
Amazon OpenSearch Service now brings application monitoring, native Amazon Managed Service for Prometheus integration, and AI agent tracing together in OpenSearch UI‘s observability workspace. You can query Prometheus metrics with PromQL alongside logs and traces stored in Amazon OpenSearch Service, trace an AI agent’s full reasoning chain down to the failing tool call, and drill from a service-level health view to the exact span that caused a checkout failure, all without leaving the interface.
In this post, we walk through two real-world scenarios using the OpenTelemetry sample app: a multi-agent travel planner facing slow processing, and a checkout flow quietly failing on one microservice. We chase each one to its root cause using these new capabilities.
Scenario 1: An underperforming AI agent
Your multi-agent travel planner is live and users start reporting slow responses. With the new AI agent tracing capability in Amazon OpenSearch Service, you can trace the agent’s full processing path to pinpoint exactly where things went wrong.
In any observability workspace in OpenSearch UI, navigate to Application Map in the left navigation pane.
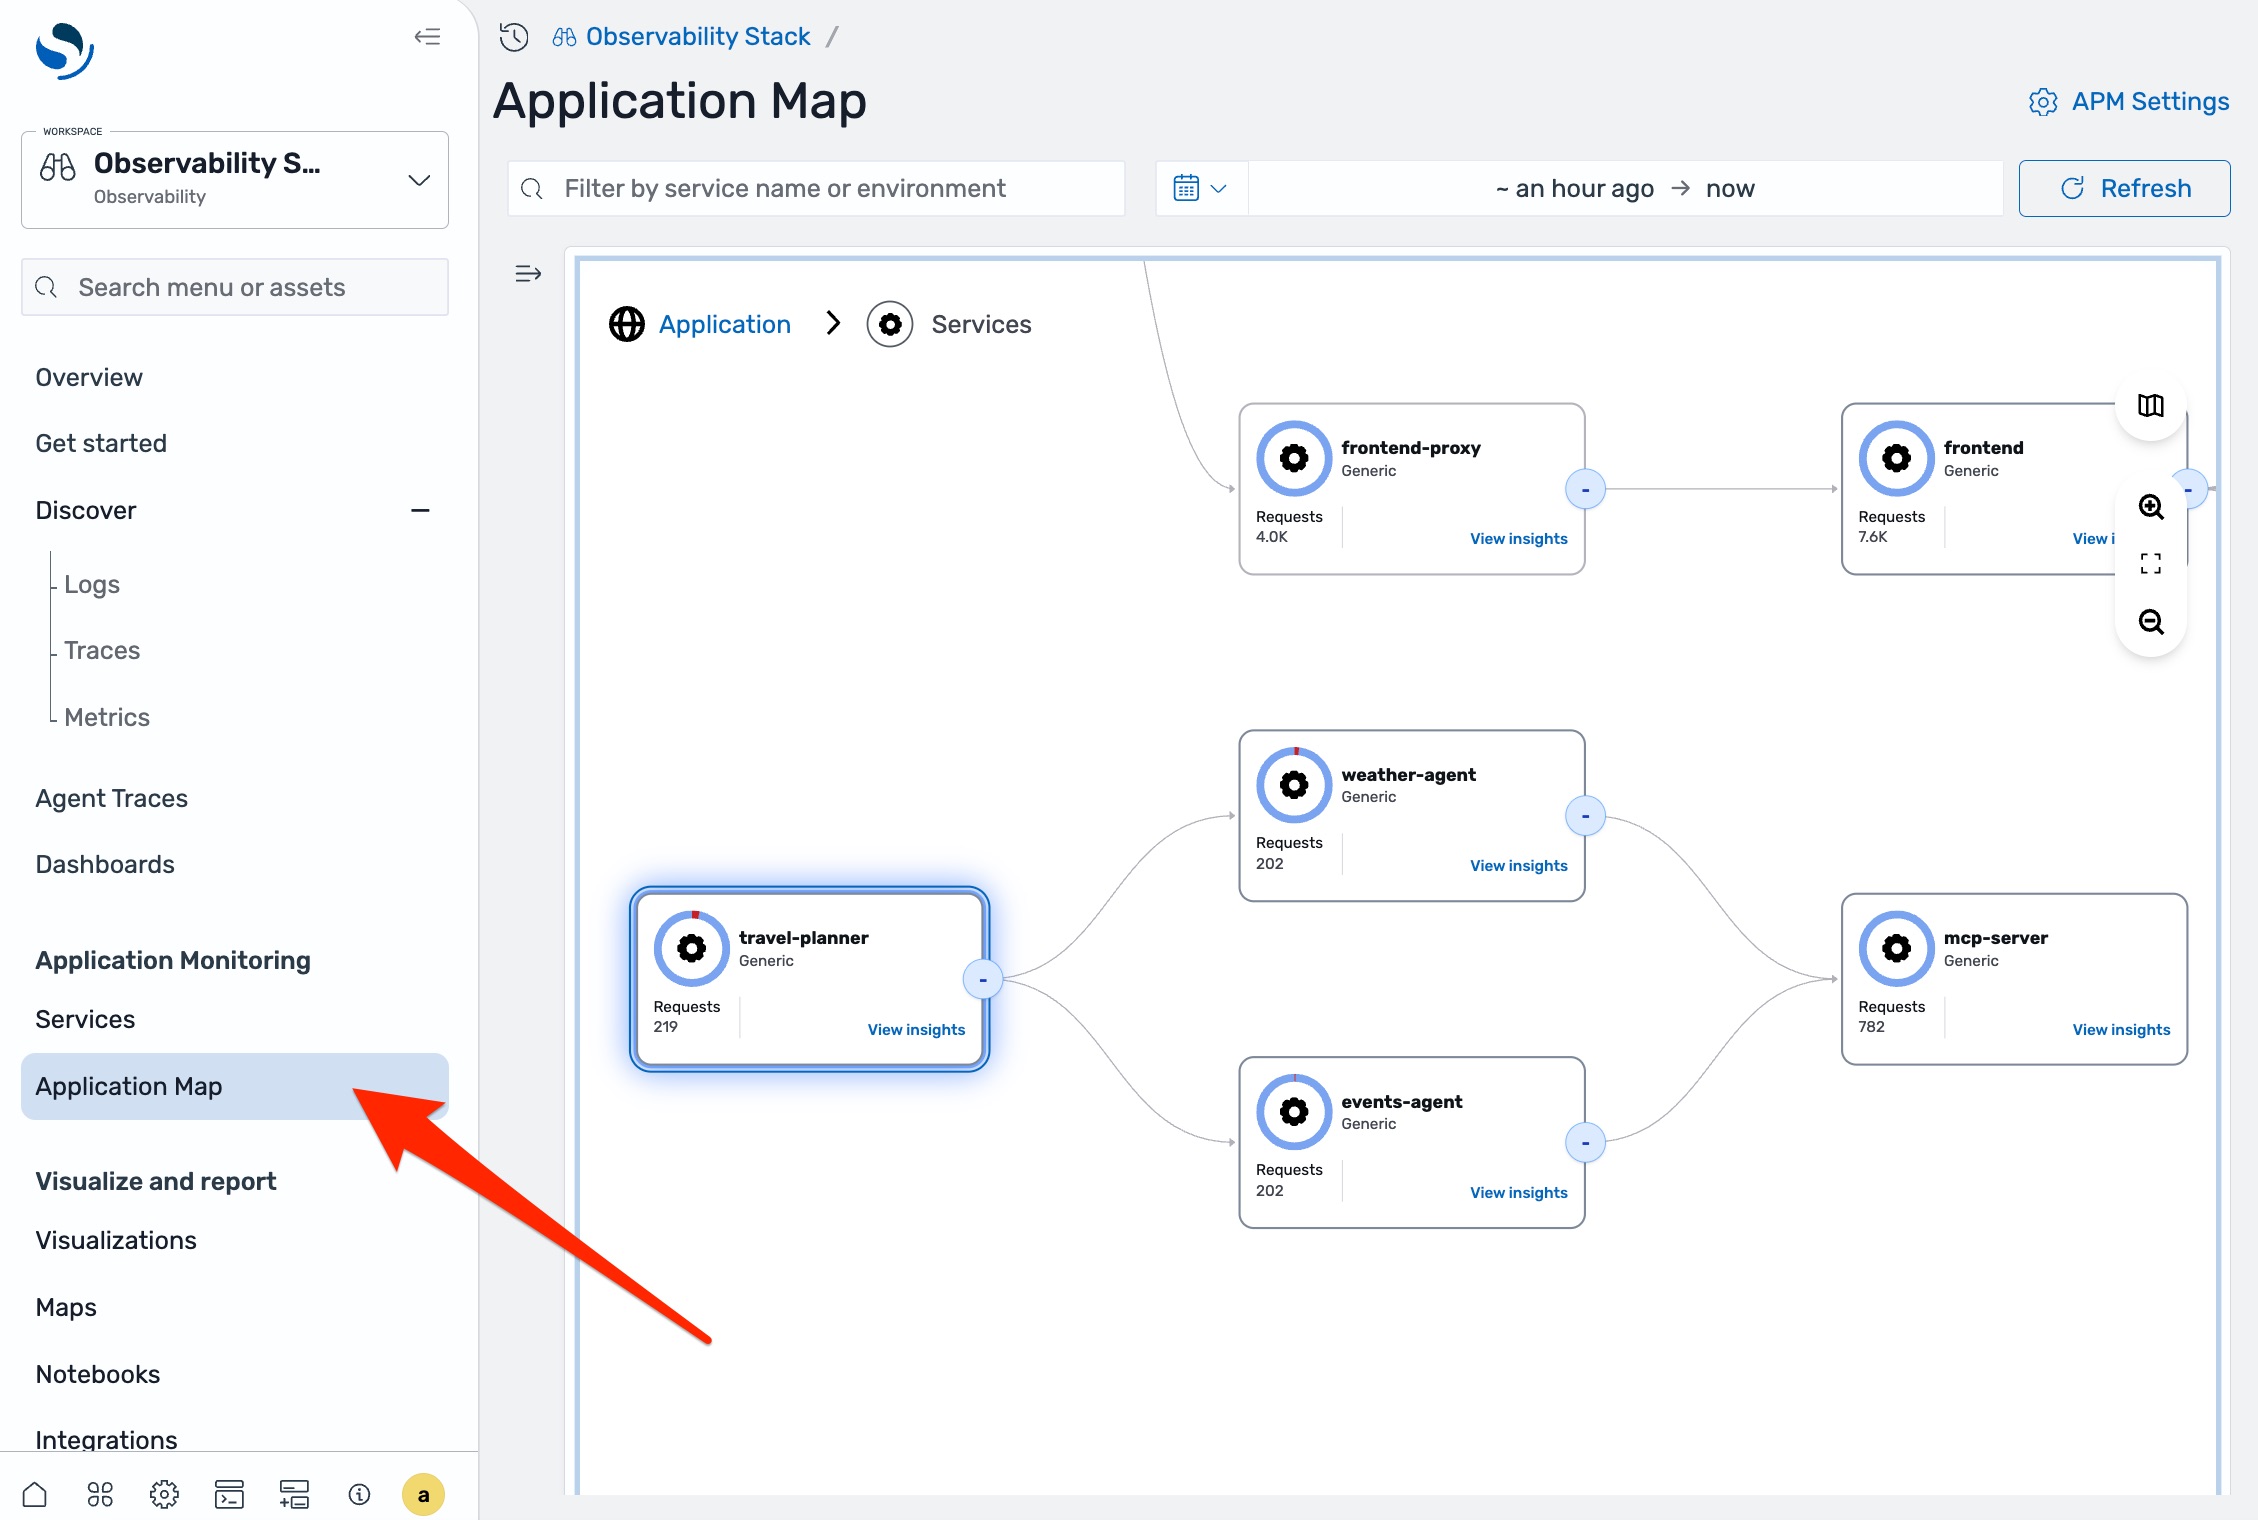
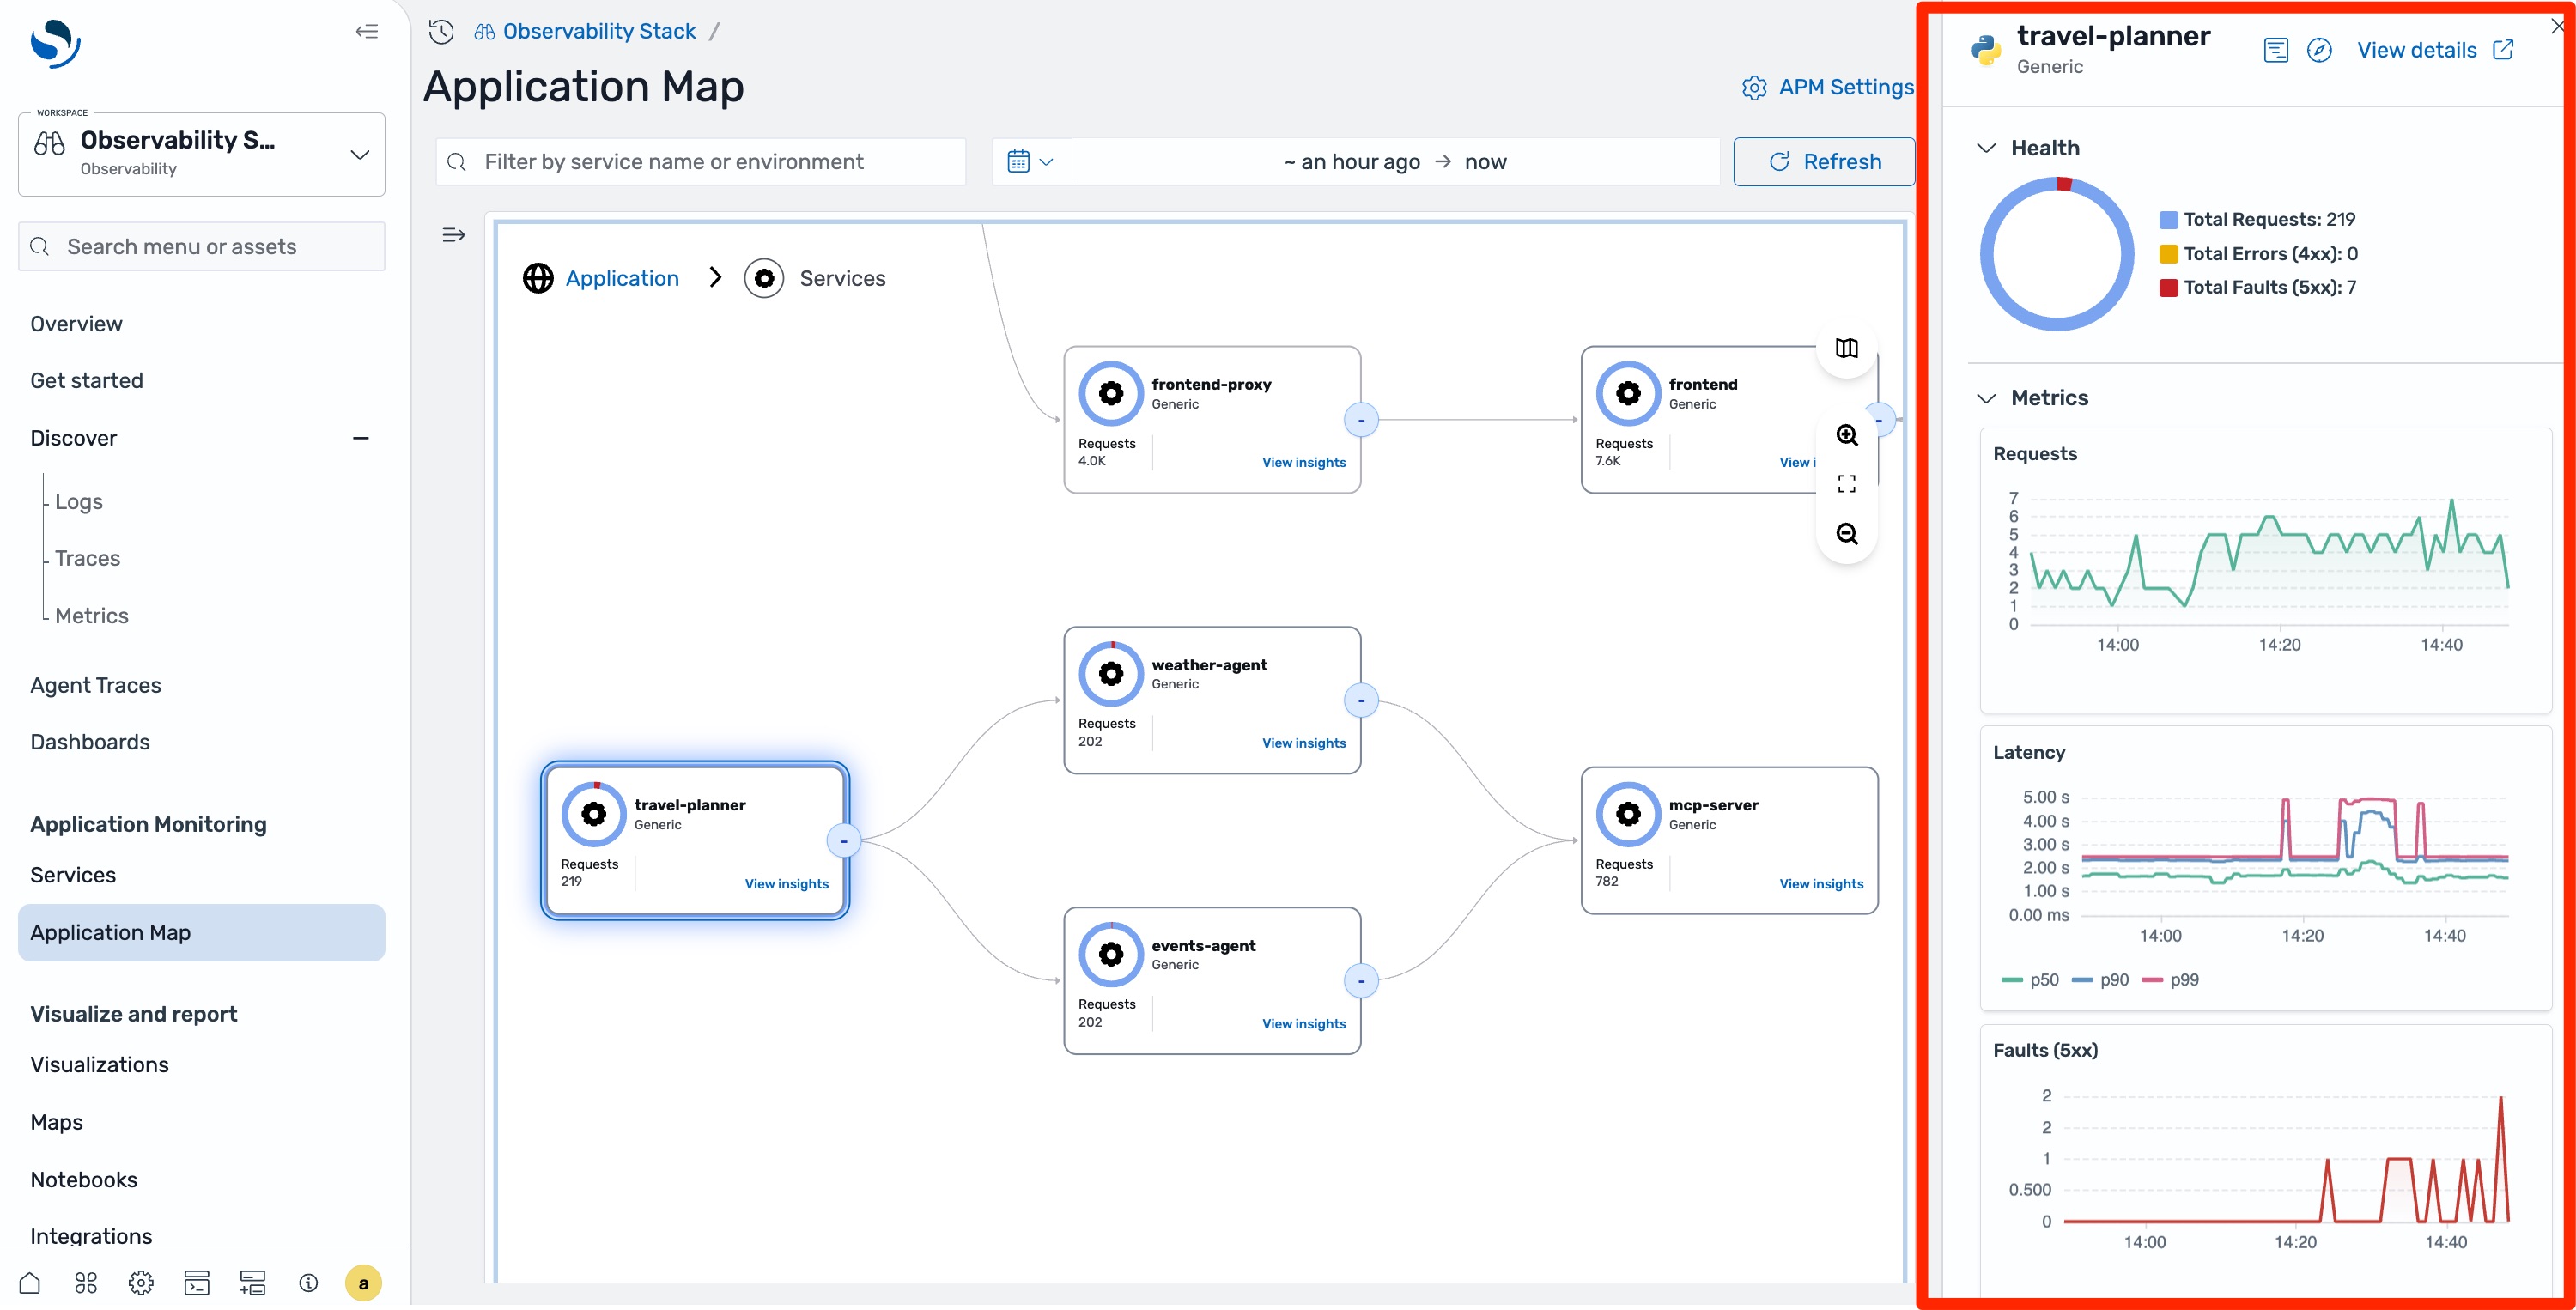
You can see the full topology of your system including the travel agent and the sub-agents it calls. The travel agent node shows elevated latency and occasional errors. Select it, and the side panel confirms that latency is up but the latency chart shows intermittent spikes rather than consistent degradation.
The application map tells you something is wrong, but understanding why an AI agent is underperforming requires seeing its reasoning chain. Select Agent Traces in the left navigation pane, then filter by service name and time range.
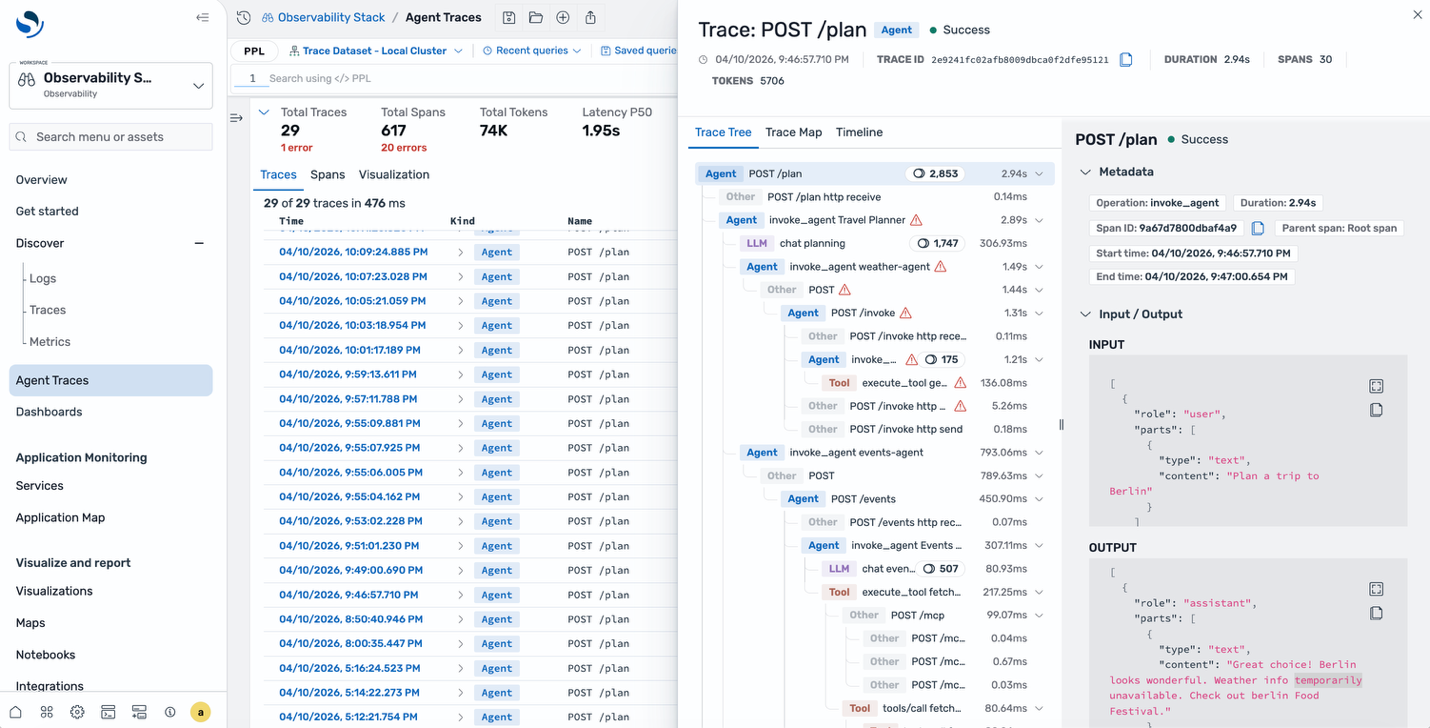
Select one of the traces to see the trace tree. Unlike a traditional span waterfall, this view organizes around the agent’s reasoning chain: the root agent span, the LLM calls it made, the tools it invoked, and how they nested each step color-coded by type. The trace map provides a visual directed graph of the same execution. You can see which model was called, how many input and output tokens were consumed, and the actual messages sent to and received from the model.
A tool call inside the weather agent errored out. The agent then spent additional time reasoning about the failure before returning a partial response explaining the intermittent latency spikes and occasional faults.
Why this matters for AI agents
Agents make autonomous decisions based on LLM responses, tool results, and chained reasoning. Unlike traditional microservices with deterministic code paths, agent behavior varies across executions. Without semantic tracing that captures these AI-specific signals, root-cause analysis is guesswork. The trace tree surfaced the model name, token counts, and failing tool call because the travel planner was instrumented with OpenTelemetry’s generative AI semantic conventions. The next section describes how.
Instrumenting AI agents
OpenTelemetry auto-instrumentation enriches spans with well-known attributes for HTTP, database, and gRPC calls. AI agents need a different set of attributes such as which LLM was called, what tokens were consumed, which tools were invoked, that standard instrumentation doesn’t cover.
The OpenTelemetry gen_ai semantic conventions define standard attributes for these signals, including gen_ai.operation.name, gen_ai.usage.input_tokens, gen_ai.request.model, and gen_ai.tool.name. When Amazon OpenSearch Service receives spans with these attributes, it categorizes them by operation type (agent, LLM, tool, embeddings, retrieval) and renders the agent trace tree and trace map views.
The Python SDK provides one way to generate these spans. To send traces to Amazon OpenSearch Ingestion, configure the SDK with AWS Signature Version 4 (SigV4) authentication. The AWSSigV4OTLPExporter cryptographically signs each HTTP request to help prevent unauthorized data ingestion. The calling identity needs an IAM policy that grants osis:Ingest on your pipeline’s ARN. Credentials are resolved through the standard AWS credential provider chain.
from opensearch_genai_observability_sdk_py import register, AWSSigV4OTLPExporter

exporter = AWSSigV4OTLPExporter(
    endpoint="
    service="osis",
    region="us-east-1",
)

register(service_name="my-agent", exporter=exporter)
Use the @observe decorator to trace agent functions and enrich() to add model metadata:
@observe(op=Op.EXECUTE_TOOL)
def get_weather(city: str) -> dict:
    return {"city": city, "temp": 22, "condition": "sunny"}

@observe(op=Op.INVOKE_AGENT)
def assistant(query: str) -> str:
    enrich(model="gpt-4o", provider="openai")
    data = get_weather("Paris")
    return f"{data['condition']}, {data['temp']}C"

result = assistant("What's the weather?")
The SDK also supports auto-instrumentation for OpenAI, Anthropic, Amazon Bedrock, LangChain, LlamaIndex, and others. Because the instrumentation is built on OpenTelemetry standards, any agent framework that emits spans with gen_ai.* attributes is compatible with OpenSearch UI.
Scenario 2: Investigating a microservice issue
AI agents are only one part of most production environments. The same interface surfaces telemetry from conventional microservices, where the troubleshooting workflow follows a more familiar path.
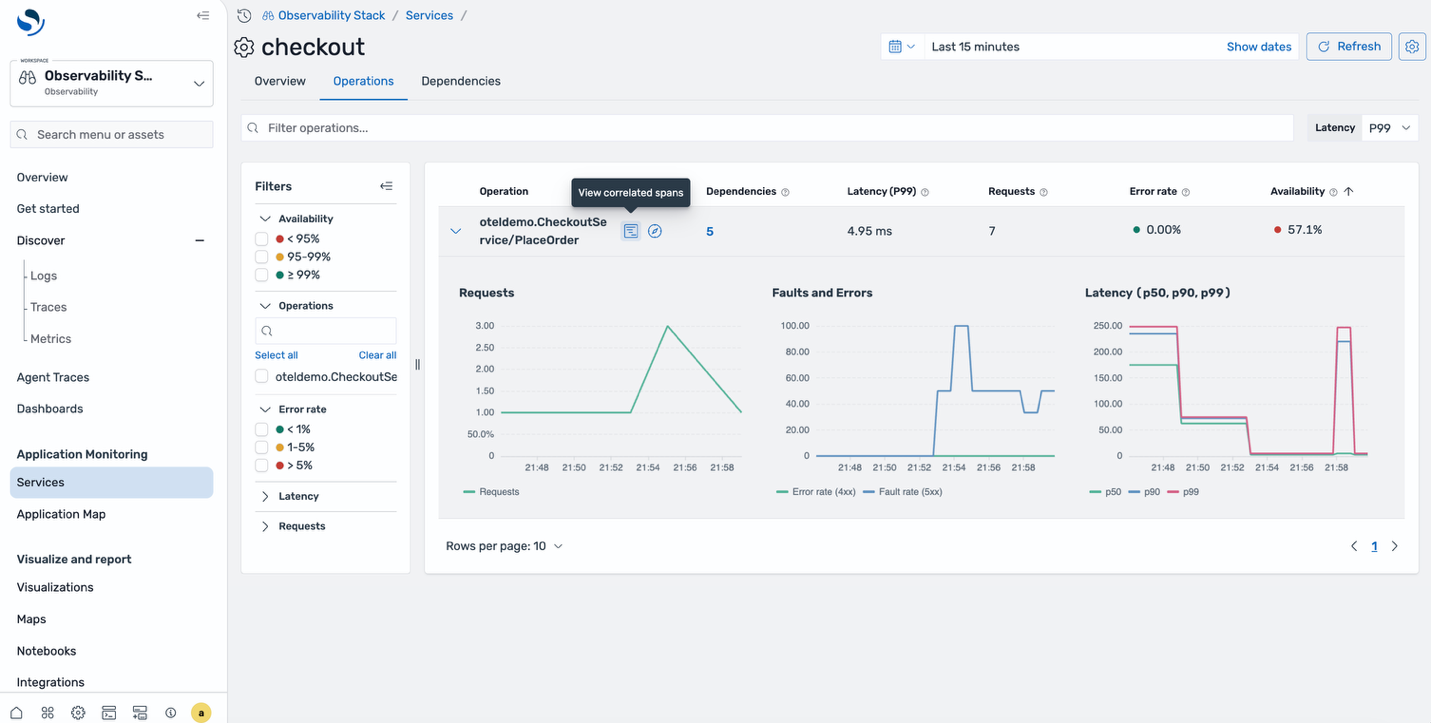
Your ecommerce checkout begins paging during a busy traffic window. From OpenSearch UI, navigate to APM Services in the left navigation pane. Every instrumented service is listed alongside its health indicators. The checkout service shows an elevated error rate.
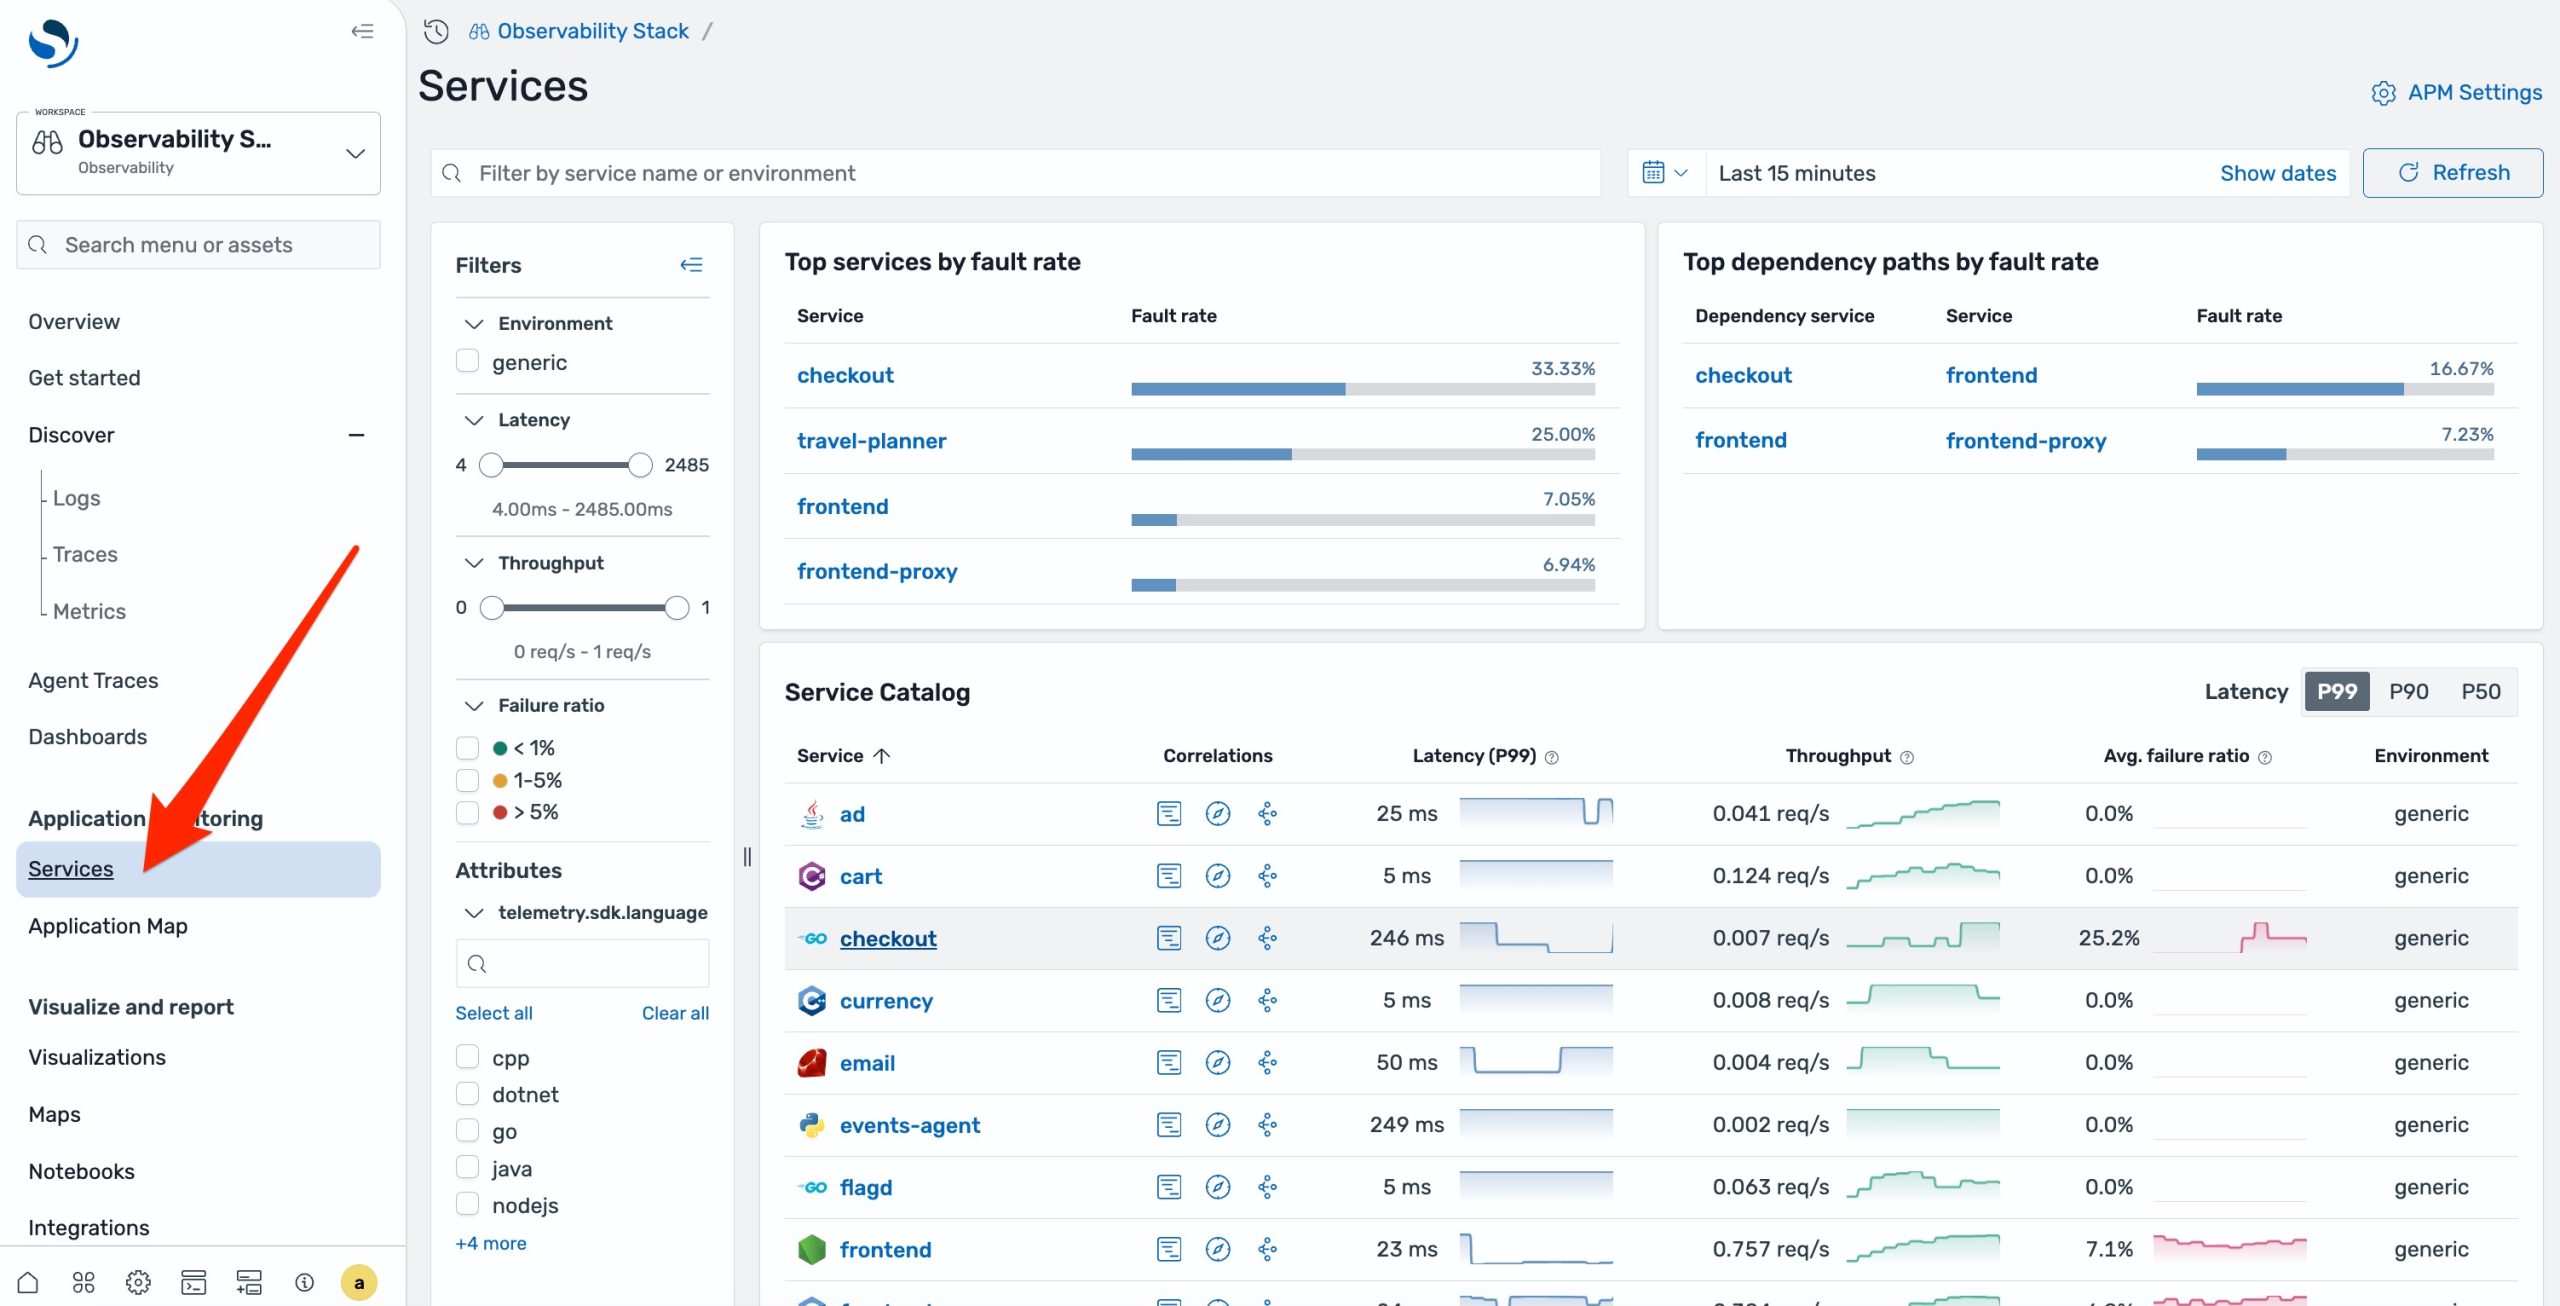
Select the affected service. The detail view shows Request, Error, and Duration (RED) metrics: request rate is climbing, fault rate has spiked in the last 15 minutes, and p99 duration has doubled. You can see exactly when the degradation started.
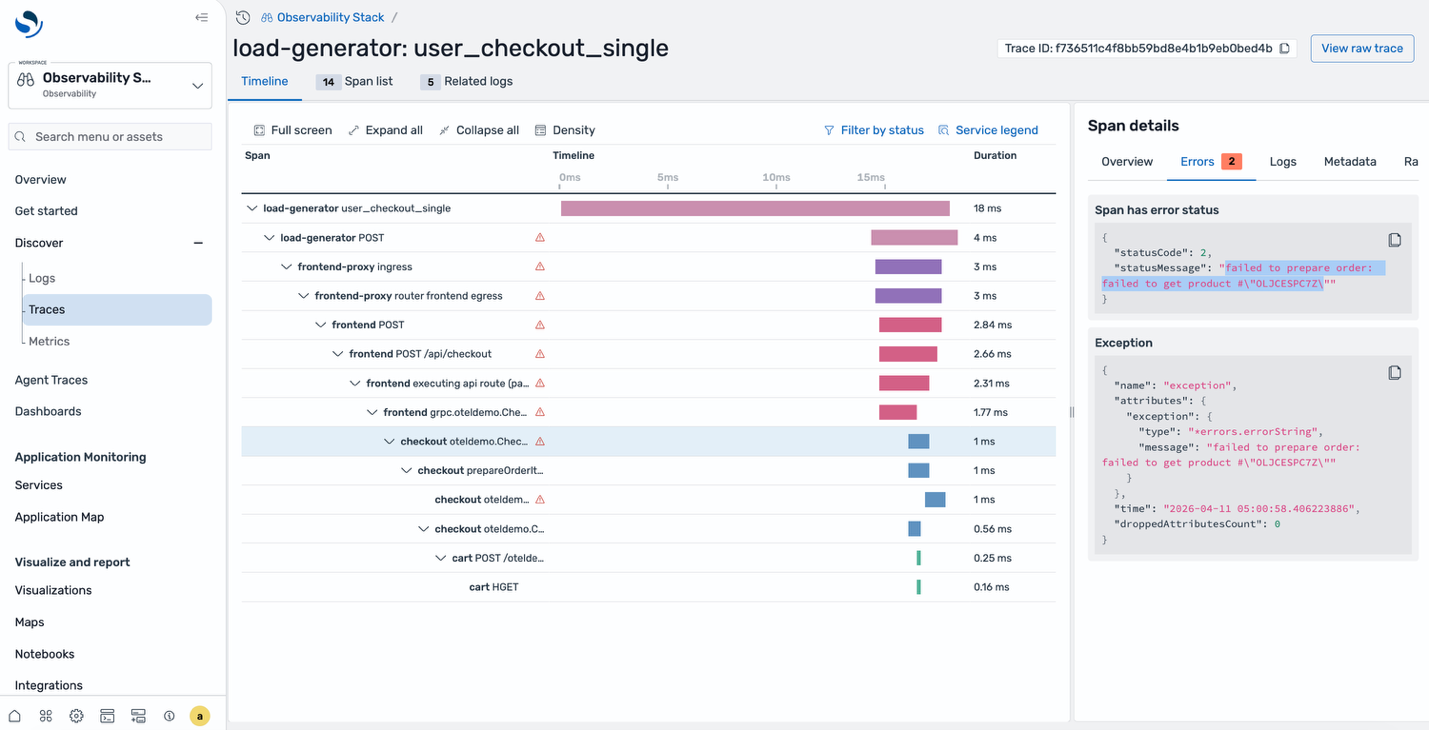
Drill into the correlated spans for the affected time window. The span list shows multiple failed requests, all hitting the same endpoint. Select one to see the full trace waterfall. The checkout service called prepareOrder, which failed trying to retrieve a product from the catalog. The error message in the span details tells you exactly what went wrong, that’s your root cause.
Checking the infrastructure with PromQL
In both scenarios, the natural next question is whether the problem originates in the application or in the infrastructure beneath it. With the new Amazon Managed Service for Prometheus integration, you can answer that question without leaving OpenSearch UI.
Prometheus metrics are now queryable directly from the same workspace using native PromQL syntax, alongside the logs and traces you’ve already been navigating.
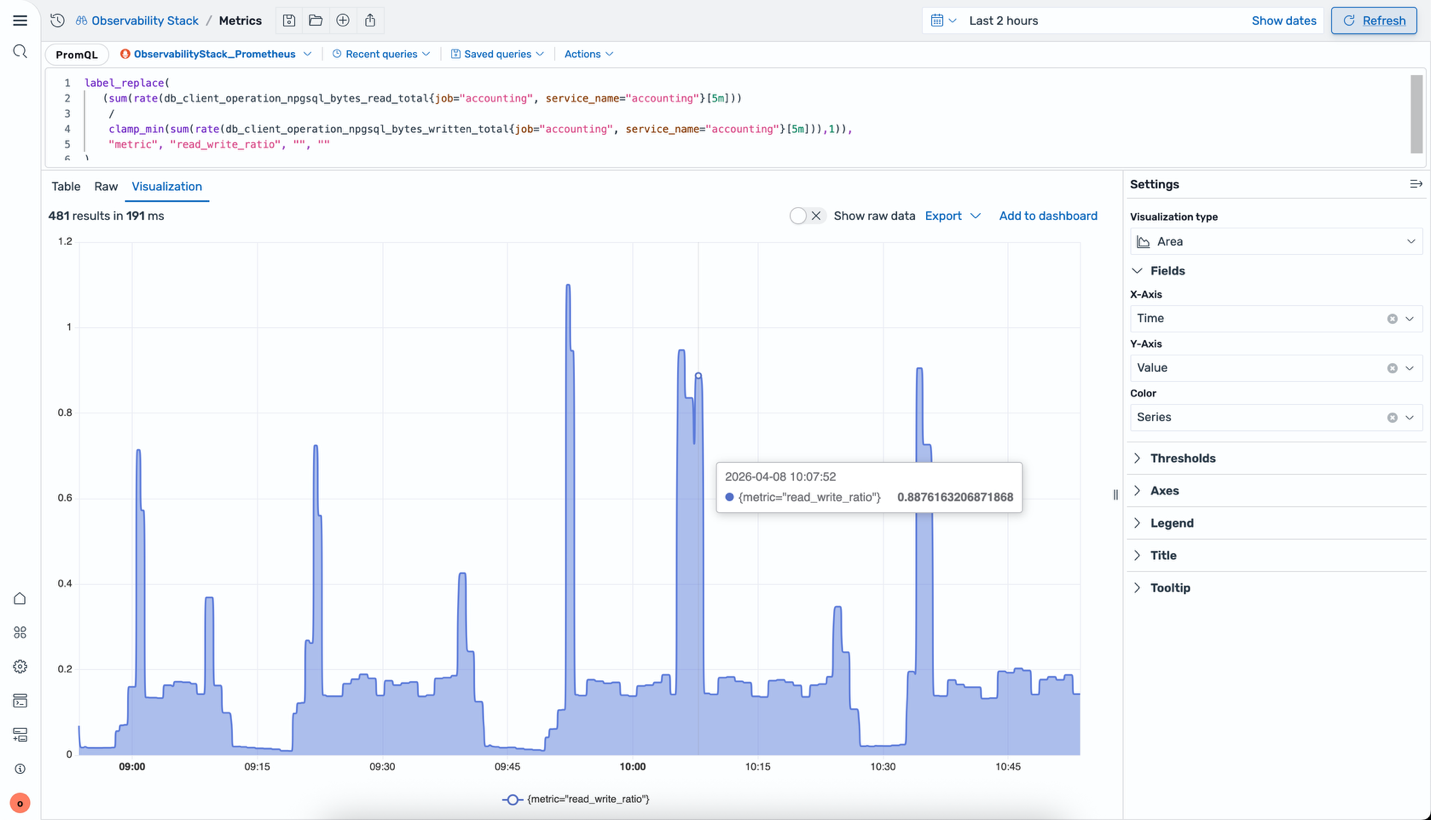
For the database timeout in Scenario 2, run a PromQL query to check the database instance’s read/write throughput for the same time window. For the agent latency issue in Scenario 1, check the LLM endpoint’s response time metrics to see if the slowness originates from the model provider.
This is a key architectural decision: metrics continue to live in Amazon Managed Service for Prometheus, logs and traces continue to live in Amazon OpenSearch Service, and neither signal is copied or warehoused into a second store. Each backend remains the single store for the data type it’s purpose-built to handle, while OpenSearch UI federates queries across both at runtime. The cost, retention, and operational model of each store stay intact while the troubleshooting workflow collapses into a single interface.
To configure the OpenTelemetry Collector and OpenSearch Ingestion pipelines that route metrics into Amazon Managed Service for Prometheus, see Ingesting application telemetry.
How it’s wired together
The following diagram shows the end-to-end architecture. Applications instrumented with OpenTelemetry send traces, logs, and metrics over OTLP to Amazon OpenSearch Ingestion. OpenSearch Ingestion routes each signal to the appropriate store: traces and logs land in Amazon OpenSearch Service, while metrics flow into Amazon Managed Service for Prometheus. OpenSearch UI then queries both stores to render the Application Map, Services catalog, Agent Traces, and Metrics views.
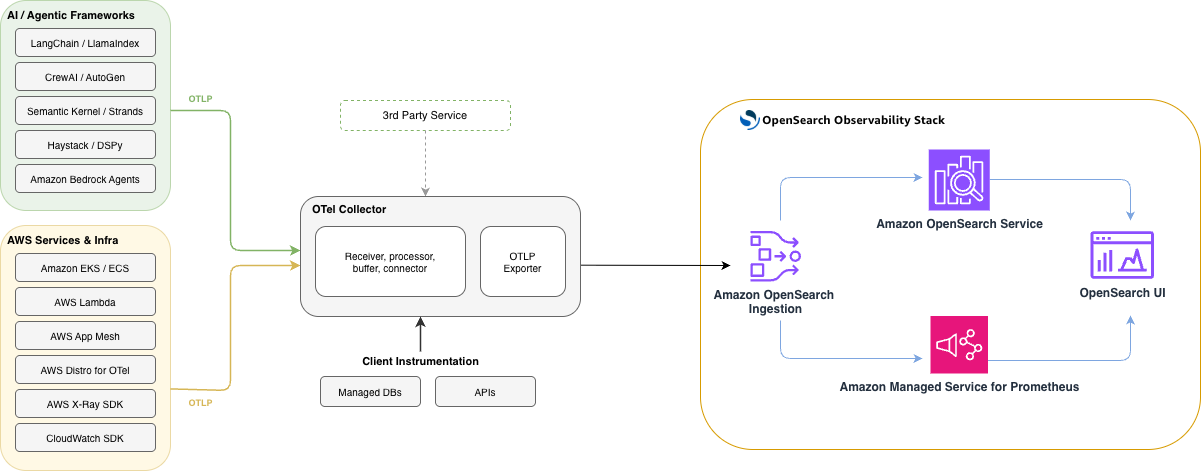
The entire experience rests on open-source foundations, Prometheus for metrics, OpenSearch for logs and traces, and OpenTelemetry for instrumentation, so teams already running an OpenTelemetry collector can adopt it by updating the collector’s export configuration to point at Amazon OpenSearch Ingestion, with no proprietary agents or rewritten instrumentation required.
Getting started
To enable these capabilities, log in to OpenSearch UI’s observability workspace, select the Gear icon in the bottom left corner to open Settings and setup, and verify that the Observability:apmEnabled toggle is on under the Observability section. OpenSearch UI is available at no additional charge for Amazon OpenSearch Service customers.
Explore locally first. The OpenSearch Observability Stack gives you a fully configured environment including application monitoring, agent tracing, and Prometheus integration, running on your machine with a single install command. It ships with sample instrumented services, including a multi-agent travel planner, so you can explore the full workflow with real telemetry data out of the box.
For AI agent development. Agent Health is an open-source, evaluation-driven observability tool designed for local development. It gives you execution flow graphs, token tracking, and tool invocation visibility right in your development loop, before you push to production.
For production. The Python SDK provides one-line setup and decorator-based tracing with gen_ai semantic conventions, with auto-instrumentation support for OpenAI, Anthropic, Amazon Bedrock, LangChain, LlamaIndex, and others. See the Amazon OpenSearch Service documentation and the Amazon Managed Service for Prometheus integration guide for the full managed experience.
About the authors