
Validating Kafka configurations before production deployment can be challenging. In this post, we introduce the workload simulation workbench for Amazon Managed Streaming for Apache Kafka (Amazon MSK) Express Broker. The simulation workbench is a tool that you can use to safely validate your streaming configurations through realistic testing scenarios.
Solution overview
Varying message sizes, partition strategies, throughput requirements, and scaling patterns make it challenging for you to predict how your Apache Kafka configurations will perform in production. The traditional approaches to test these variables create significant barriers: ad-hoc testing lacks consistency, manual set up of temporary clusters is time-consuming and error-prone, production-like environments require dedicated infrastructure teams, and team training often happens in isolation without realistic scenarios. You need a structured way to test and validate these configurations safely before deployment. The workload simulation workbench for MSK Express Broker addresses these challenges by providing a configurable, infrastructure as code (IaC) solution using AWS Cloud Development Kit (AWS CDK) deployments for realistic Apache Kafka testing. The workbench supports configurable workload scenarios, and real-time performance insights.
Express brokers for MSK Provisioned make managing Apache Kafka more streamlined, more cost-effective to run at scale, and more elastic with the low latency that you expect. Each broker node can provide up to 3x more throughput per broker, scale up to 20x faster, and recover 90% quicker compared to standard Apache Kafka brokers. The workload simulation workbench for Amazon MSK Express broker facilitates systematic experimentation with consistent, repeatable results. You can use the workbench for multiple use cases like production capacity planning, progressive training to prepare developers for Apache Kafka operations with increasing complexity, and architecture validation to prove streaming designs and compare different approaches before making production commitments.
Architecture overview
The workbench creates an isolated Apache Kafka testing environment in your AWS account. It deploys a private subnet where consumer and producer applications run as containers, connects to a private MSK Express broker and monitors for performance metrics and visibility. This architecture mirrors the production deployment pattern for experimentation. The following image describes this architecture using AWS services.
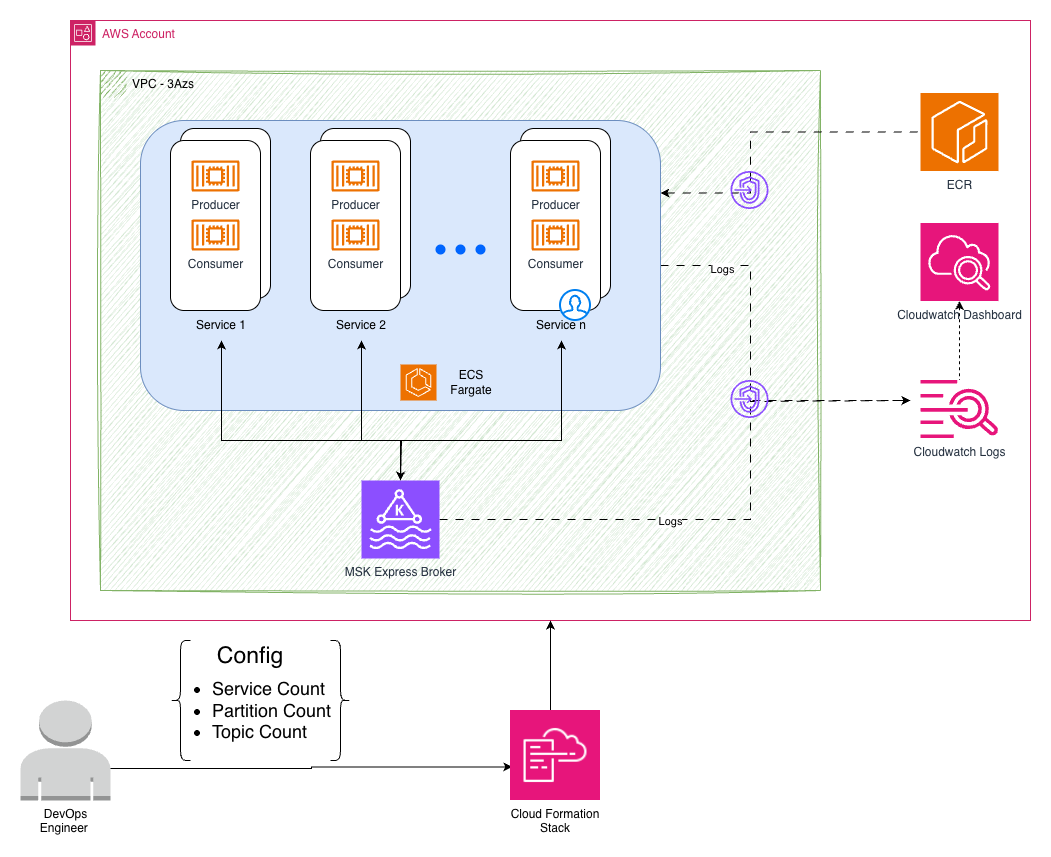
This architecture is deployed using the following AWS services:
Amazon Elastic Container Service (Amazon ECS) generate configurable workloads with Java-based producers and consumers, simulating various real-world scenarios through different message sizes and throughput patterns.
Amazon MSK Express Cluster runs Apache Kafka 3.9.0 on Graviton-based instances with hands-free storage management and enhanced performance characteristics.
Dynamic Amazon CloudWatch Dashboards automatically adapt to your configuration, displaying real-time throughput, latency, and resource utilization across different test scenarios.
Secure Amazon Virtual Private Cloud (Amazon VPC) Infrastructure provides private subnets across three Availability Zones with VPC endpoints for secure service communication.
Configuration-driven testing
The workbench provides different configuration options for your Apache Kafka testing environment, so you can customize instance types, broker count, topic distribution, message characteristics, and ingress rate. You can adjust the number of topics, partitions per topic, sender and receiver service instances, and message sizes to match your testing needs. These flexible configurations support two distinct testing approaches to validate different aspects of your Kafka deployment:
Approach 1: Workload validation (single deployment)
Test different workload patterns against the same MSK Express cluster configuration. This is useful for comparing partition strategies, message sizes, and load patterns.
Approach 2: Infrastructure rightsizing (redeploy and compare)
Test different MSK Express cluster configurations by redeploying the workbench with different broker settings while keeping the same workload. This is recommended for rightsizing experiments and understanding the impact of vertical compared to horizontal scaling.
Each redeployment uses the same workload configuration, so you can isolate the impact of infrastructure changes on performance.
Workload testing scenarios (single deployment)
These scenarios test different workload patterns against the same MSK Express cluster:
Partition strategy impact testing
Scenario: You are debating the usage of fewer topics with many partitions compared to many topics with fewer partitions for your microservices architecture. You want to understand how partition count affects throughput and consumer group coordination before making this architectural decision.
Message size performance analysis
Scenario: Your application handles different types of events – small IoT sensor readings (256 bytes), medium user activity events (1 KB), and large document processing events (8KB). You must understand how message size impacts your overall system performance and if you should separate these into different topics or handle them together.
Load testing and scaling validation
Scenario: You expect traffic to vary significantly throughout the day, with peak loads requiring 10× more processing capacity than off-peak hours. You want to validate how your Apache Kafka topics and partitions handle different load levels and understand the performance characteristics before production deployment.
Infrastructure rightsizing experiments (redeploy and compare)
These scenarios help you understand the impact of different MSK Express cluster configurations by redeploying the workbench with different broker settings:
MSK broker rightsizing analysis
Scenario: You deploy a cluster with basic configuration and put load on it to establish baseline performance. Then you want to experiment with different broker configurations to see the effect of vertical scaling (larger instances) and horizontal scaling (more brokers) to find the right cost-performance balance for your production deployment.
Step 1: Deploy with baseline configuration
Step 2: Redeploy with vertical scaling
Step 3: Redeploy with horizontal scaling
This rightsizing approach helps you understand how broker configuration changes affect the same workload, so you can improve both performance and cost for your specific requirements.
Performance insights
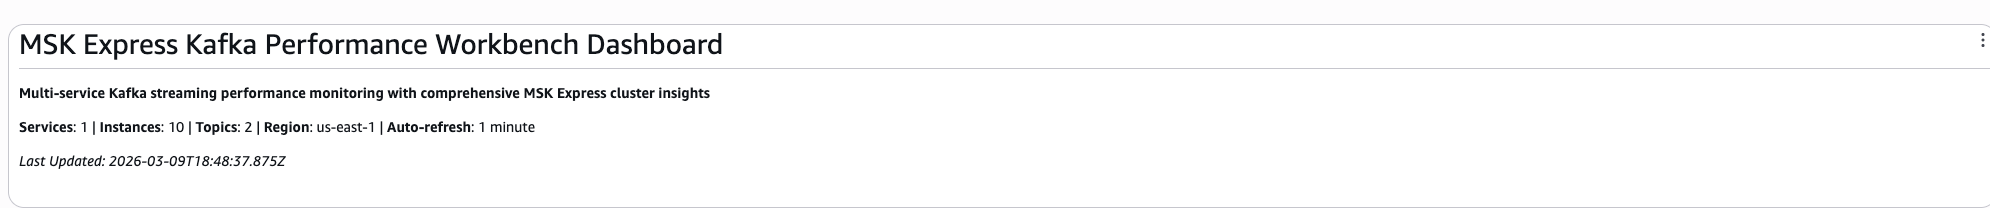
The workbench provides detailed insights into your Apache Kafka configurations through monitoring and analytics, creating a CloudWatch dashboard that adapts to your configuration. The dashboard starts with a configuration summary showing your MSK Express cluster details and workbench service configurations, helping you to understand what you’re testing. The following image shows the dashboard configuration summary:
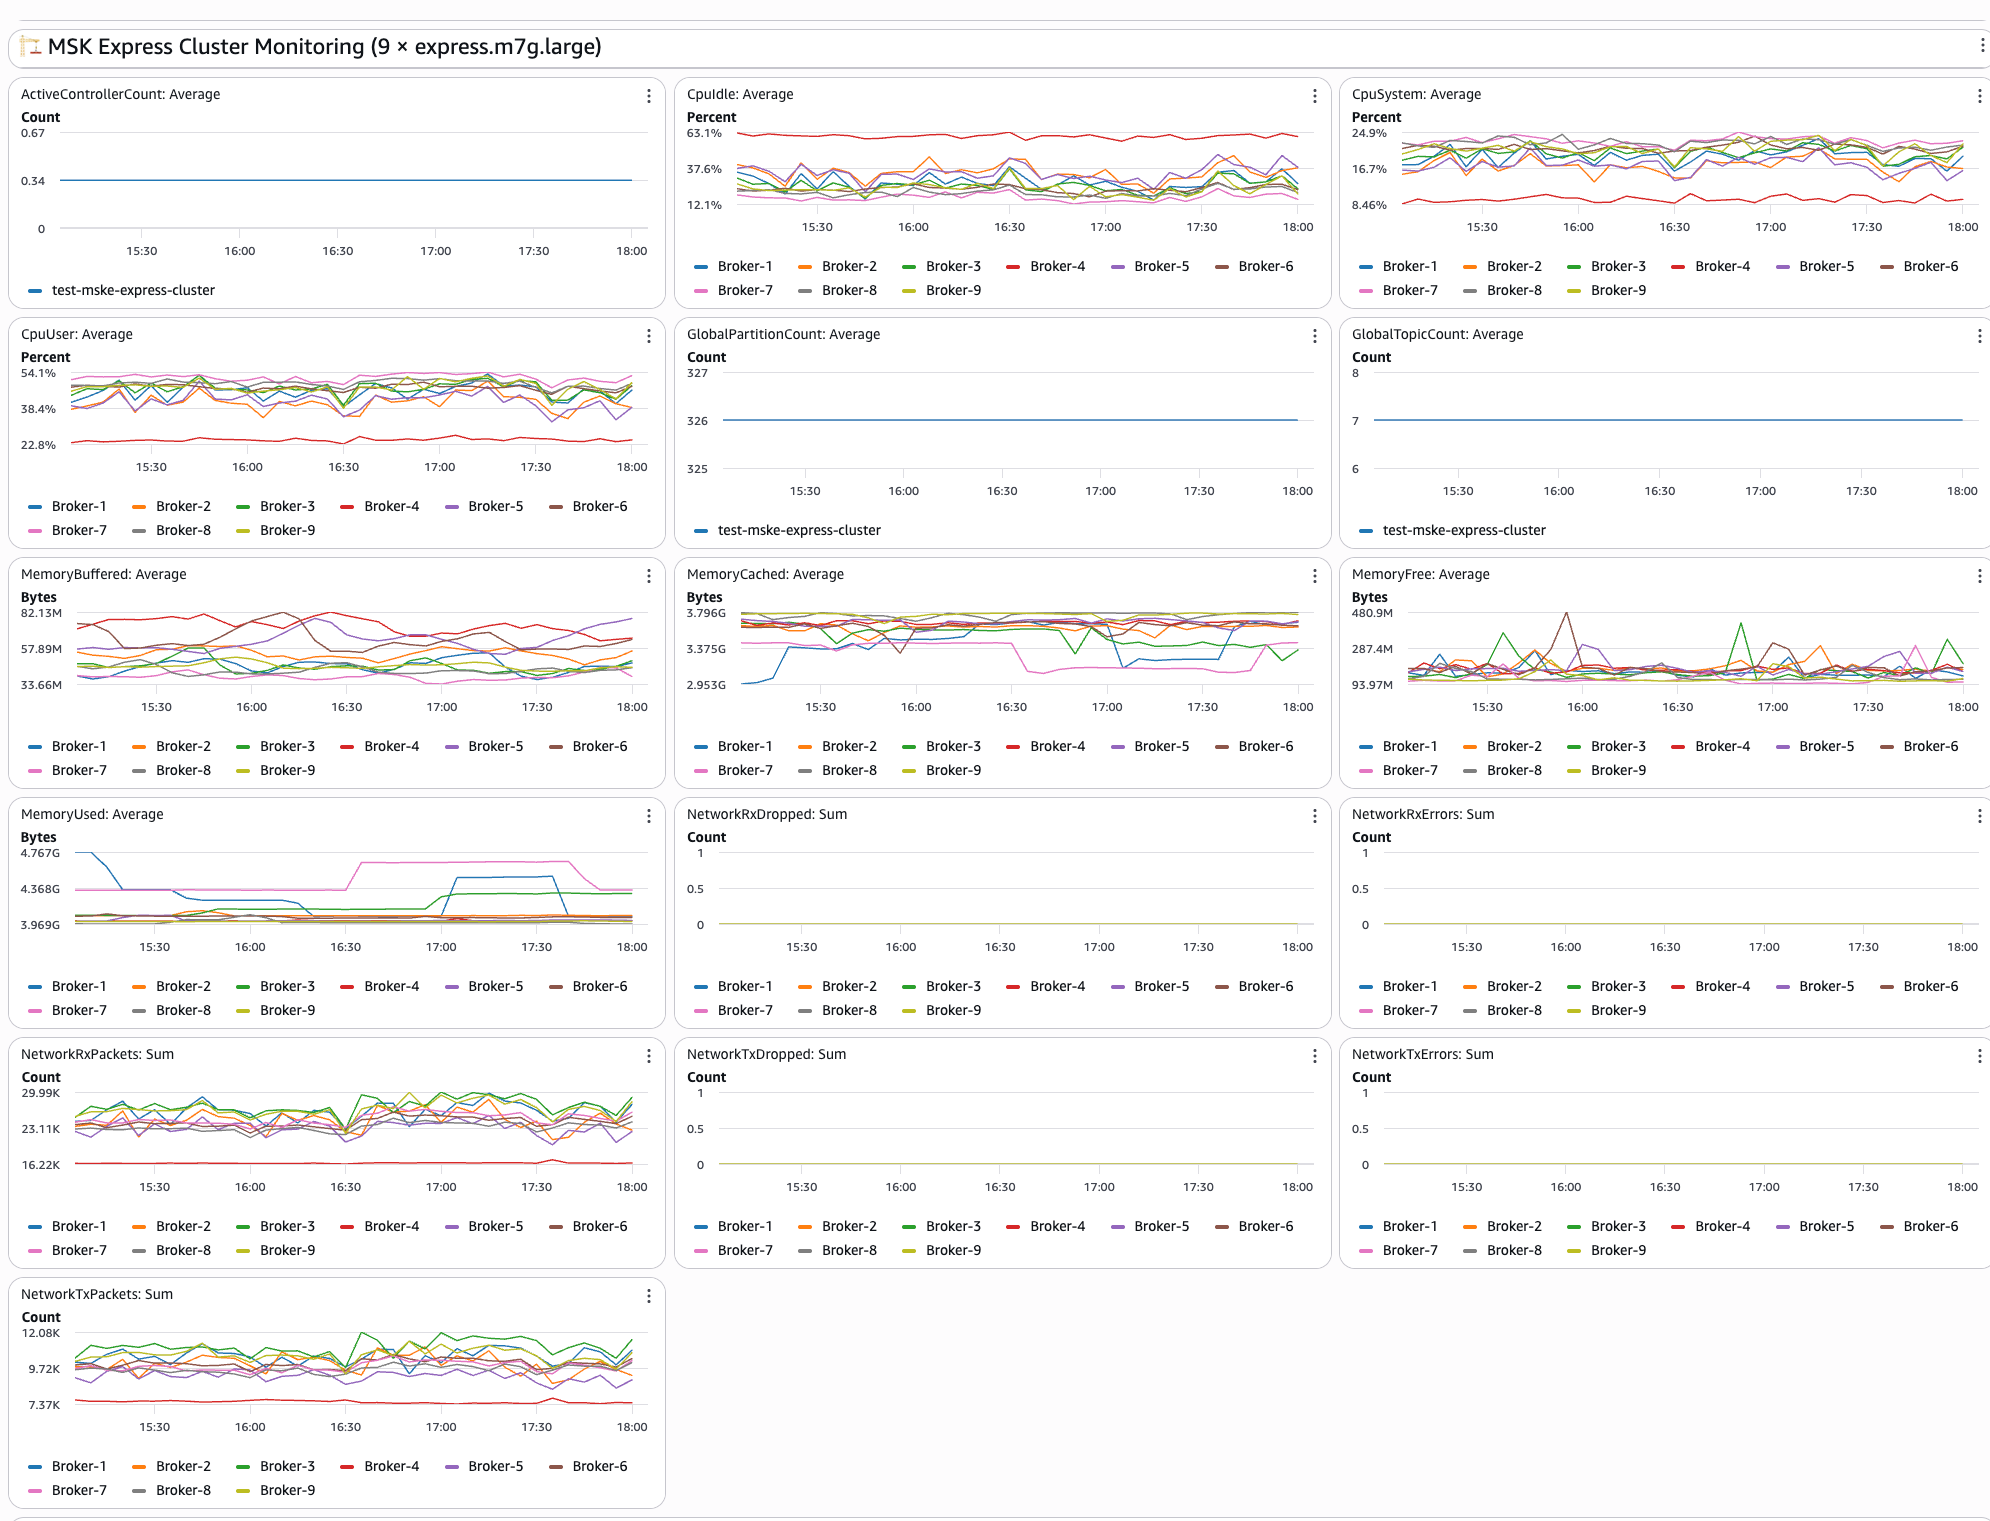
The second section of dashboard shows real-time MSK Express cluster metrics including:
- Broker performance: CPU utilization and memory usage across brokers in your cluster
- Network activity: Monitor bytes in/out and packet counts per broker to understand network utilization patterns
- Connection monitoring: Displays active connections and connection patterns to help identify potential bottlenecks
- Resource utilization: Broker-level resource tracking provides insights into overall cluster health
The following image shows the MSK cluster monitoring dashboard:
The third section of the dashboard shows the Intelligent Rebalancing and Cluster Capacity insights showing:
- Intelligent rebalancing: in progress: Shows whether a rebalancing operation is currently in progress or has occurred in the past. A value of 1 indicates that rebalancing is actively running, while 0 means that the cluster is in a steady state.
- Cluster under-provisioned: Indicates whether the cluster has insufficient broker capacity to perform partition rebalancing. A value of 1 means that the cluster is under-provisioned and Intelligent Rebalancing can’t redistribute partitions until more brokers are added or the instance type is upgraded.
- Global partition count: Displays the total number of unique partitions across all topics in the cluster, excluding replicas. Use this to track partition growth over time and validate your deployment configuration.
- Leader count per broker: Shows the number of leader partitions assigned to each broker. An uneven distribution indicates partition leadership skew, which can lead to hotspots where certain brokers handle disproportionate read/write traffic.
- Partition count per broker: Shows the total number of partition replicas hosted on each broker. This metric includes both leader and follower replicas and is key to identifying replica distribution imbalances across the cluster.
The following image shows the Intelligent Rebalancing and Cluster Capacity section of the dashboard:
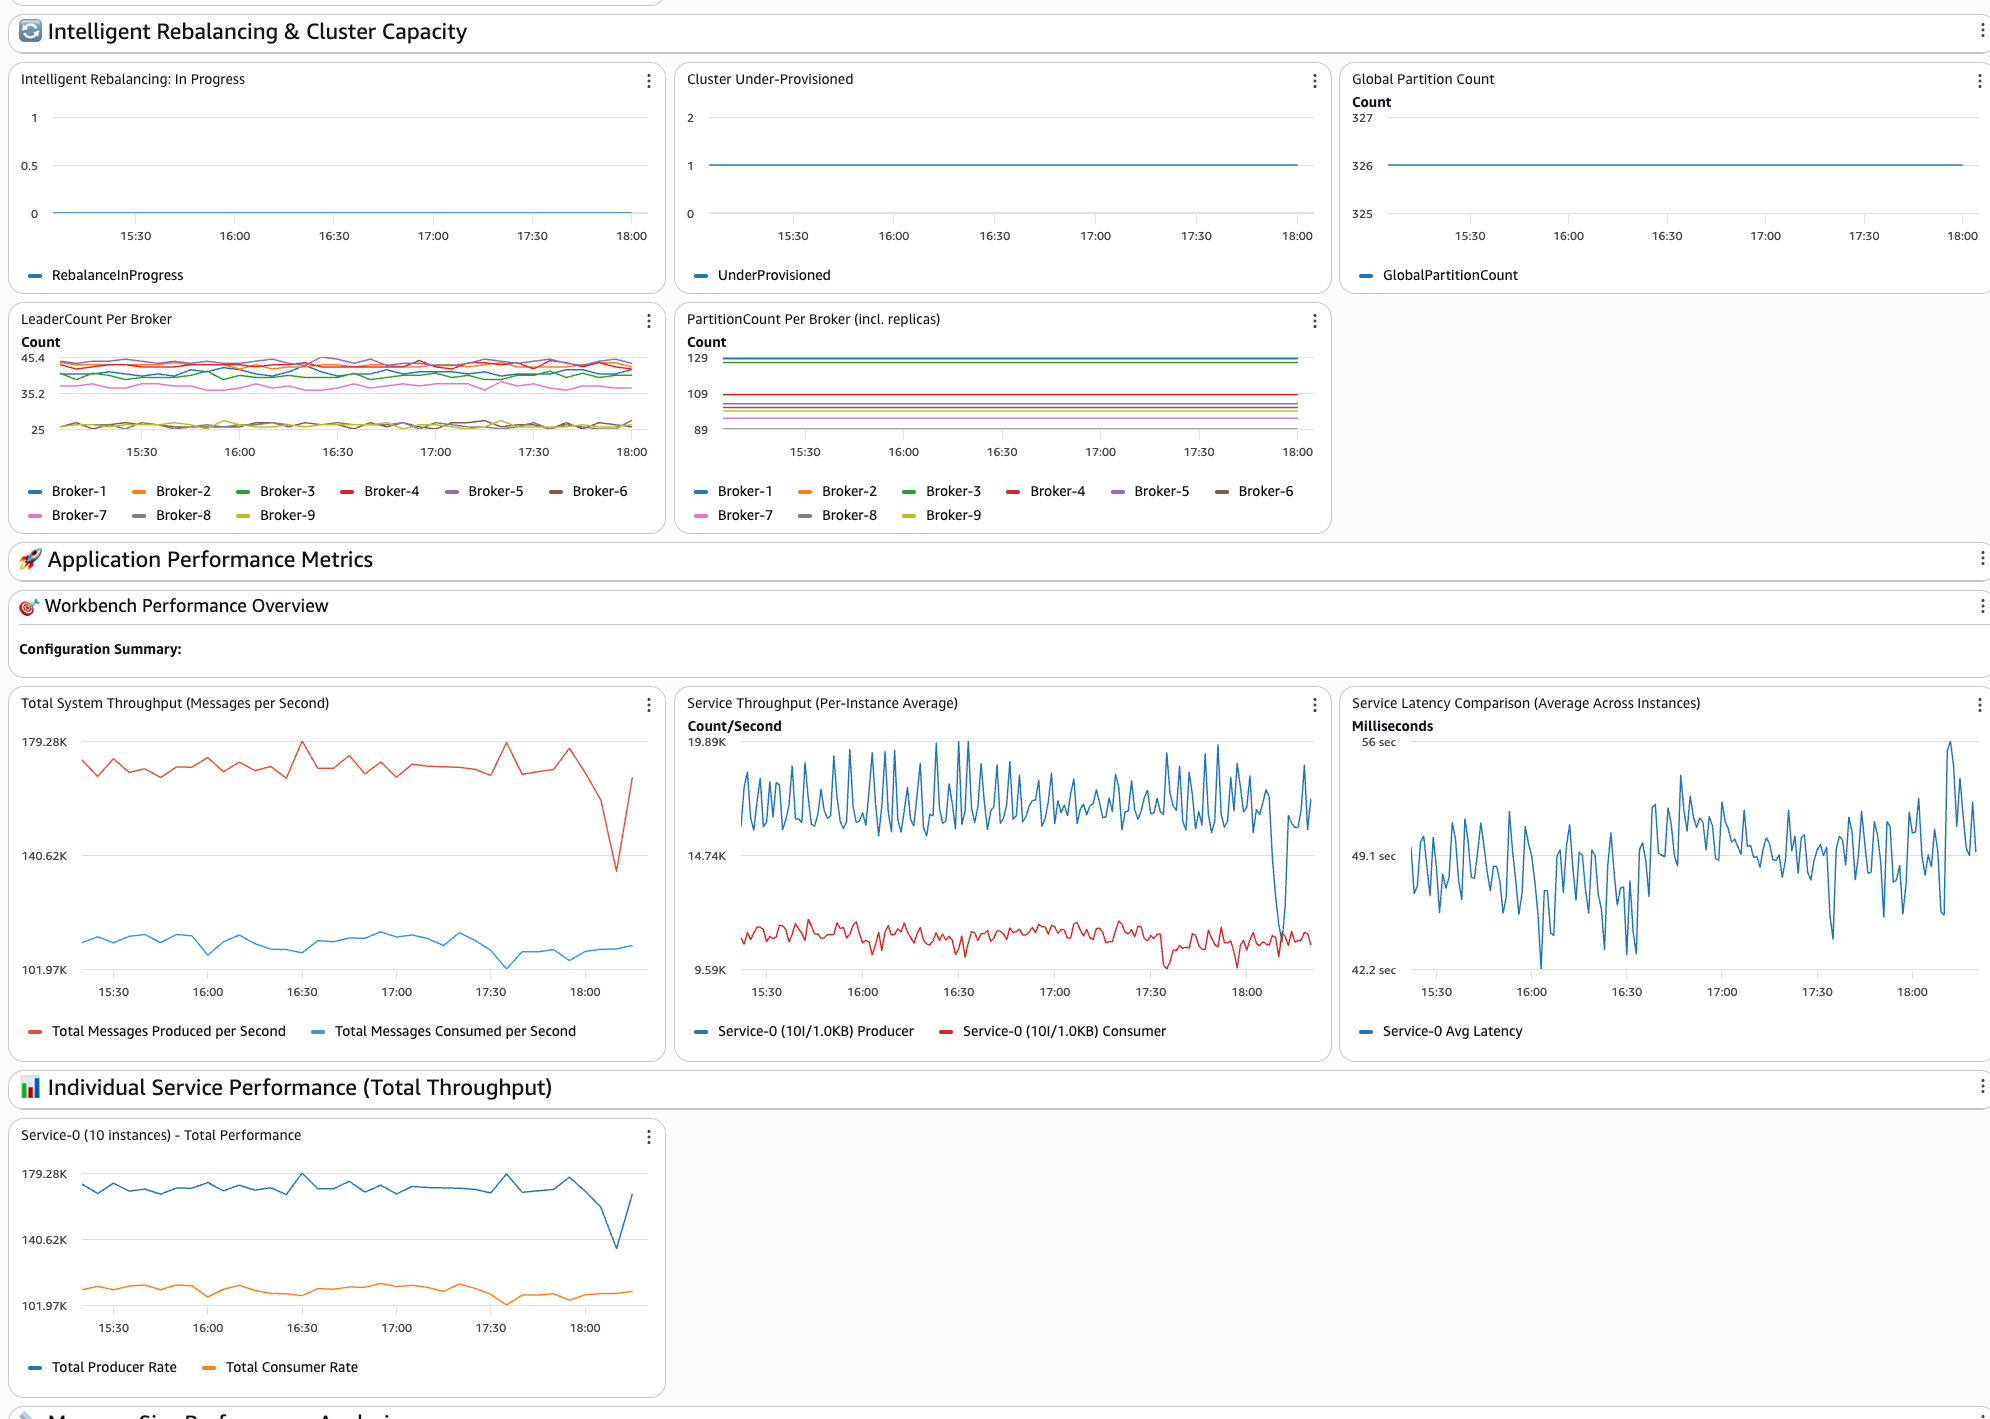
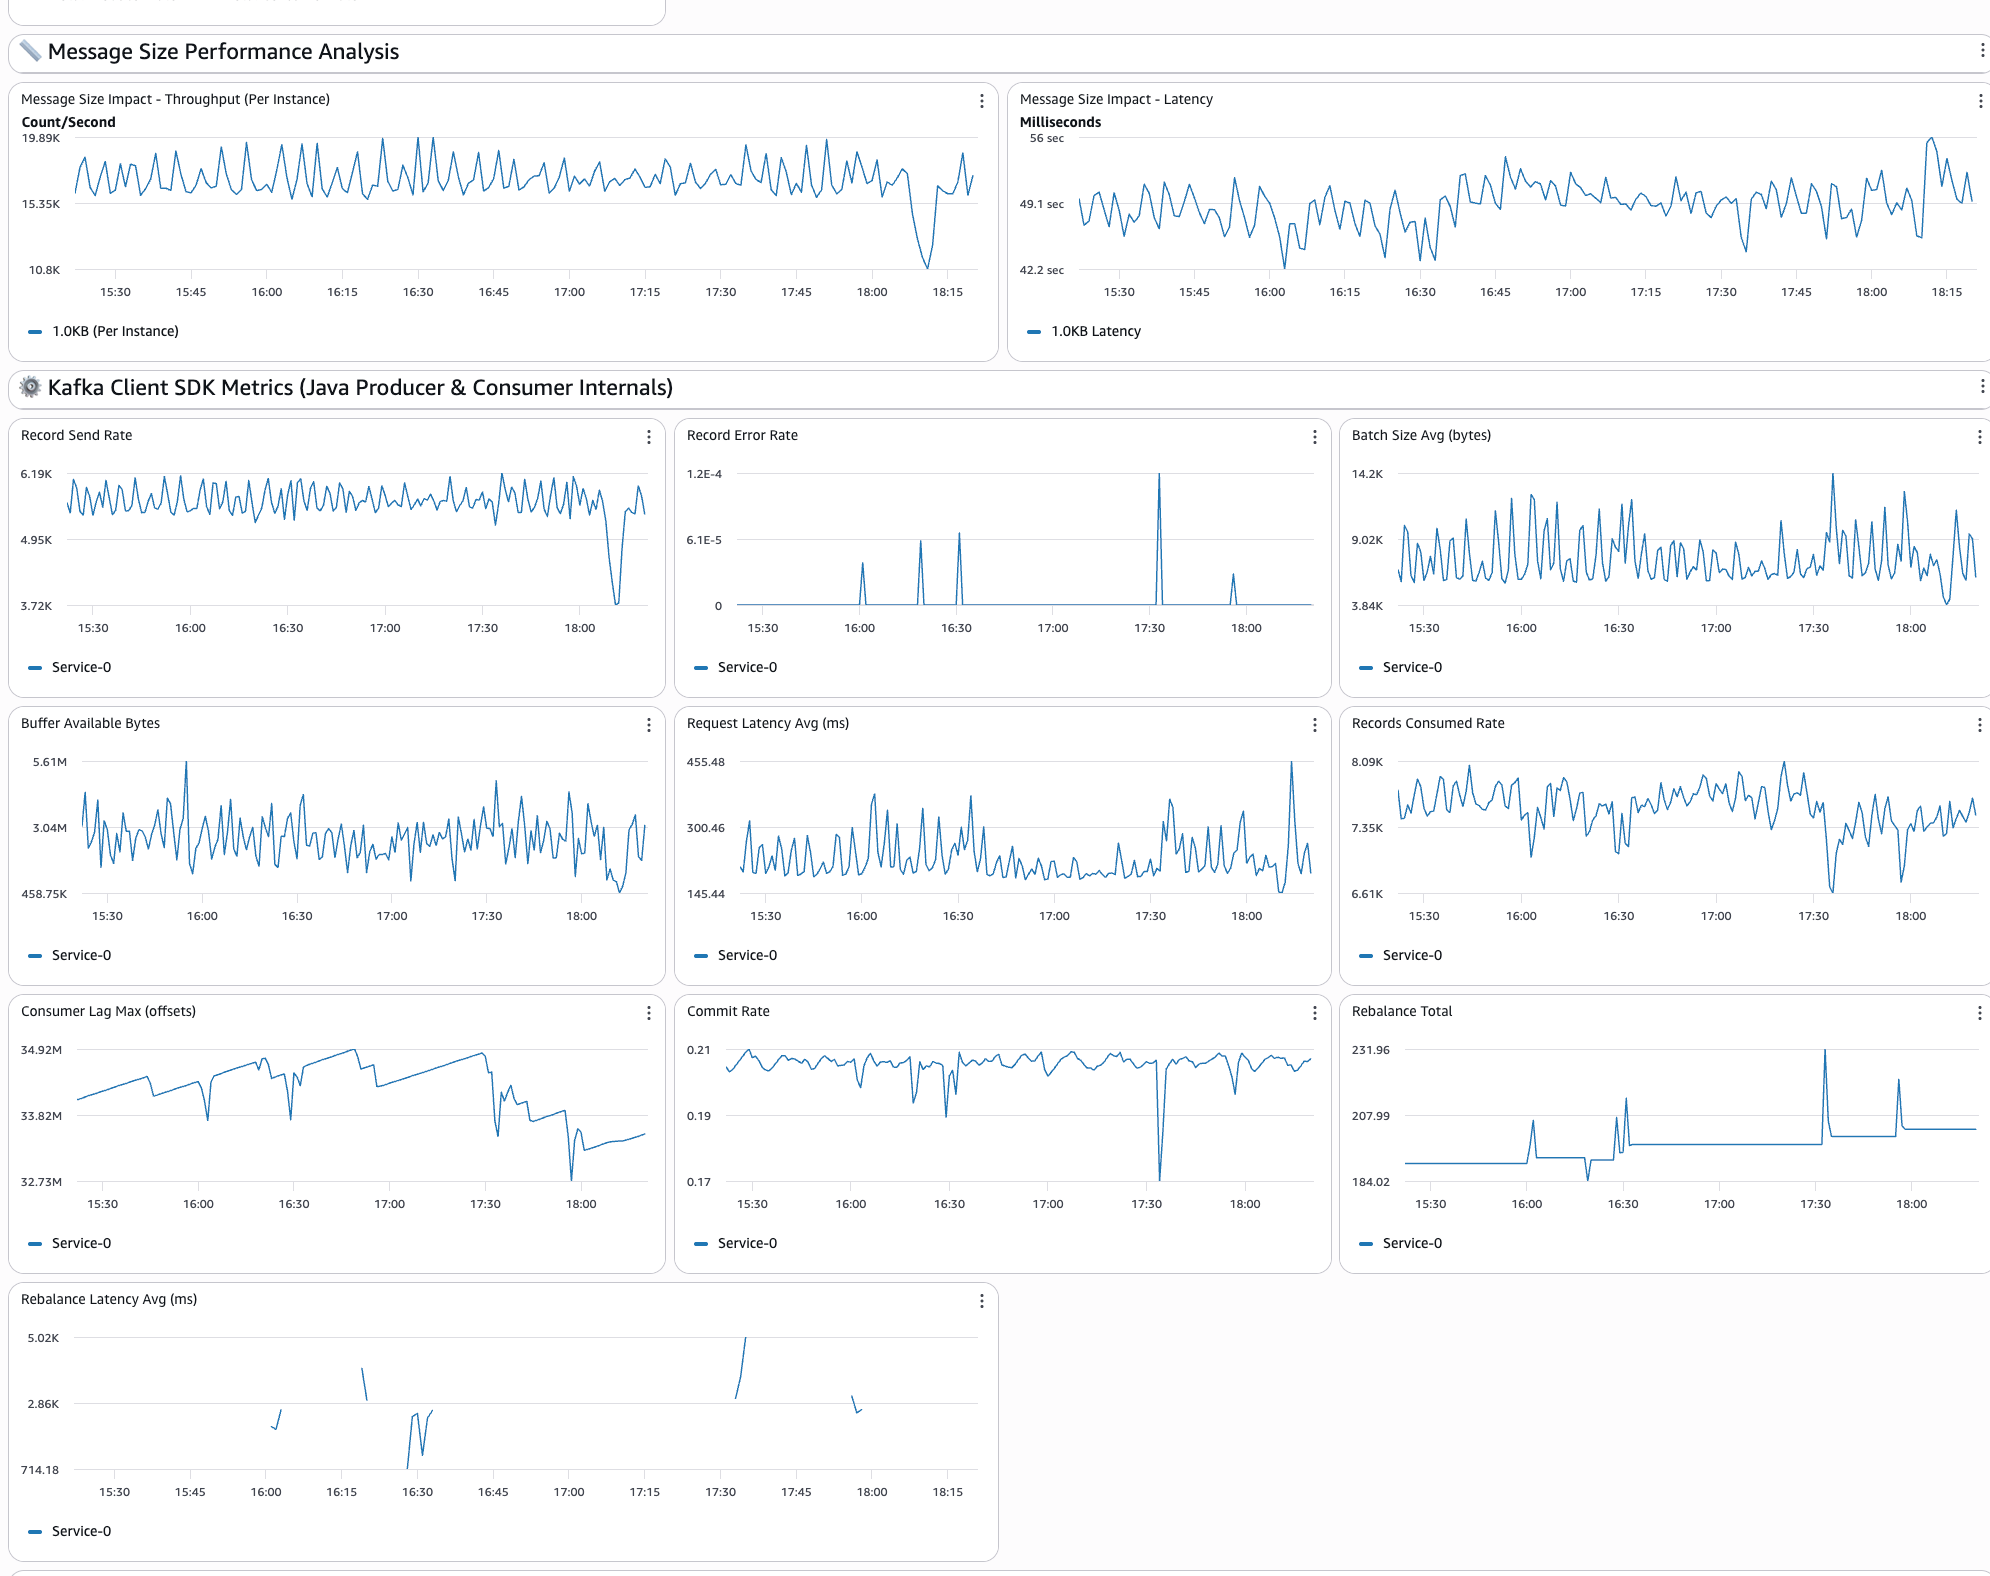
The fourth section of the dashboard shows the application-level insights showing:
- System throughput: Displays the total number of messages per second across services, giving you a complete view of system performance
- Service comparisons: Performs side-by-side performance analysis of different configurations to understand which approaches fit
- Individual service performance: Each configured service has dedicated throughput tracking widgets for detailed analysis
- Latency analysis: The end-to-end message delivery times and latency comparisons across different service configurations
- Message size impact: Performance analysis across different payload sizes helps you understand how message size affects overall system behavior
The following image shows the application performance metrics section of the dashboard:
Getting started
This section walks you through setting up and deploying the workbench in your AWS environment. You will configure the necessary prerequisites, deploy the infrastructure using AWS CDK, and customize your first test.
Prerequisites
You can deploy the solution from the GitHub Repo. You can clone it and run it on your AWS environment. To deploy the artifacts, you will require:
- AWS account with administrative credentials configured for creating AWS resources.
- AWS Command Line Interface (AWS CLI) must be configured with appropriate permissions for AWS resource management.
- AWS Cloud Development Kit (AWS CDK) should be installed globally using npm install -g aws-cdk for infrastructure deployment.
- Node.js version 20.9 or higher is required, with version 22+ recommended.
- Docker engine must be installed and running locally as the CDK builds container images during deployment. Docker daemon should be running and accessible to CDK for building the workbench application containers.
Deployment
After deployment is completed, you will receive a CloudWatch dashboard URL to monitor the workbench performance in real-time.You can also deploy multiple isolated instances of the workbench in the same AWS account for different teams, environments, or testing scenarios. Each instance operates independently with its own MSK cluster, ECS services, and CloudWatch dashboards.To deploy additional instances, modify the Environment Configuration in cdk/lib/config.ts:
Each combination of AppPrefix and EnvPrefix creates completely isolated AWS resources so that multiple teams or environments can use the workbench simultaneously without conflicts.
Customizing your first test
You can edit the configuration file located at folder “cdk/lib/config-types.ts” to define your testing scenarios and run the deployment. It is preconfigured with the following configuration:
Best practices
Following a structured approach to benchmarking ensures that your results are reliable and actionable. These best practices will help you isolate performance variables and build a clear understanding of how each configuration change affects your system’s behavior. Begin with single-service configurations to establish baseline performance:
After you understand the baseline, add comparison scenarios.
Change one variable at a time
For clear insights, modify only one parameter between services:
This approach helps you understand the impact of specific configuration changes.
Important considerations and limitations
Before relying on workbench results for production decisions, it is important to understand the tool’s intended scope and boundaries. The following considerations will help you set appropriate expectations and make the most effective use of the workbench in your planning process.
Performance testing disclaimer
The workbench is designed as an educational and sizing estimation tool to help teams prepare for MSK Express production deployments. While it provides valuable insights into performance characteristics:
- Results can vary based on your specific use cases, network conditions, and configurations
- Use workbench results as guidance for initial sizing and planning
- Conduct comprehensive performance validation with your actual workloads in production-like environments before final deployment
Recommended usage approach
Production readiness training – Use the workbench to prepare teams for MSK Express capabilities and operations.
Architecture validation – Test streaming architectures and performance expectations using MSK Express enhanced performance characteristics.
Capacity planning – Use MSK Express streamlined sizing approach (throughput-based rather than storage-based) for initial estimates.
Team preparation – Build confidence and expertise with production Apache Kafka implementations using MSK Express.
Conclusion
In this post, we showed how the workload simulation workbench for Amazon MSK Express Broker supports learning and preparation for production deployments through configurable, hands-on testing and experiments. You can use the workbench to validate configurations, build expertise, and improve performance before production deployment. If you’re preparing for your first Apache Kafka deployment, training a team, or improving existing architectures, the workbench provides practical experience and insights needed for success. Refer to Amazon MSK documentation – Complete MSK Express documentation, best practices, and sizing guidance for more information.
About the authors