

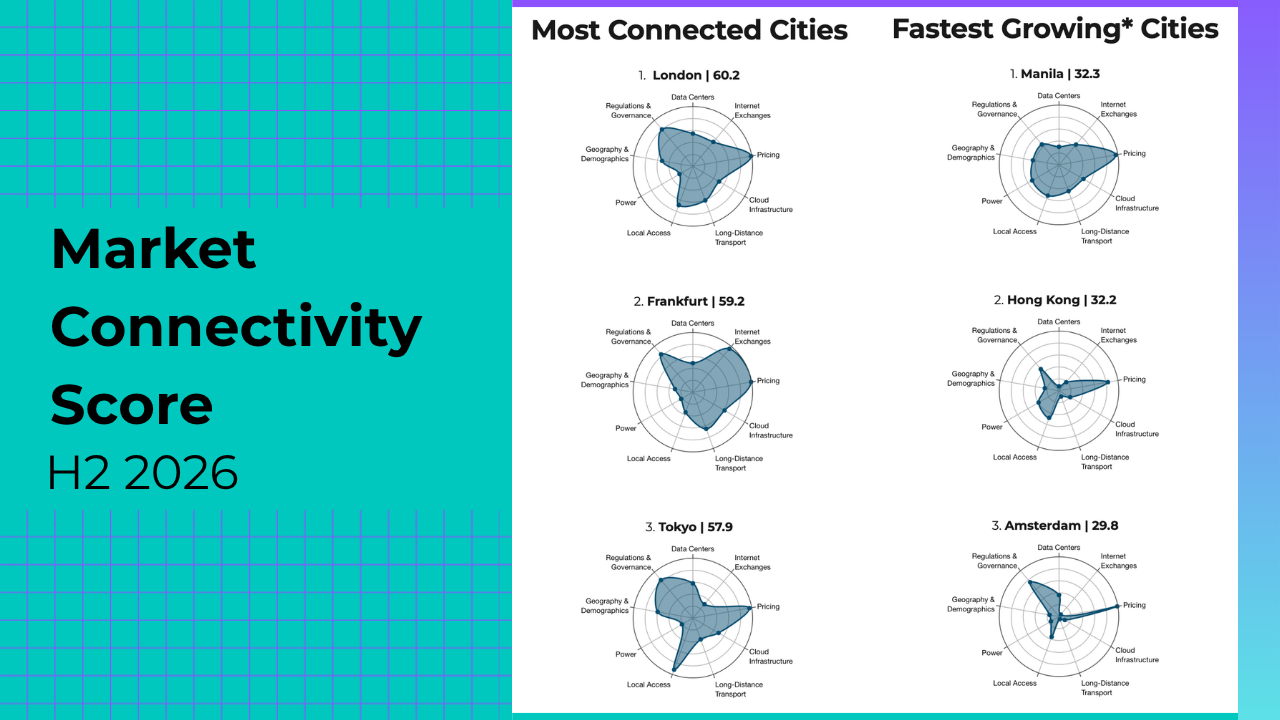
Which cities are the most connected, and which ones are the fastest growing for internet infrastructure? Which cities are best poised to support AI?
Twice a year, we make public our assessment of the top 10 most connected and fastest-growing cities with our Market Connectivity Score—an interactive tool in our Data Center Research Service. The Market Connectivity Score tracks 45 different data points for every city, including:
- Data center power,
- Number of ASNs peering locally,
- Cloud onramps, and more.
And those data points create scores in each category for cities on a scale of 0-100. So without further ado, here are the most connected and fastest growing cities for H2 2026.
Most connected cities: H2 2026
- London | 60.2
- Frankfurt | 59.2
- Tokyo | 57.9
- Amsterdam | 55.6
- Singapore | 54.2
- Washington, DC | 52.2
- New York | 51.8
- Paris | 50.5
- Hong Kong | 50.2
- Los Angeles, CA | 47.5
Most connected cities, H2 2026 vs. H1 2026
Compared with the list of most connected cities in the world for H1 2026, H2 was a remix. The top 10 cities remained the same, with a reshuffling of:
London (1), Frankfurt (2), Tokyo (3), Washington, DC (6), New York (7), and Los Angeles (10) held their ranks from H1 2026 to H2 2026.
|
Most Connected Cities – TeleGeography’s Market Connectivity Score |
||
|
Ranking |
H2 2026 |
H1 2026 |
|
1 |
London |
London |
|
2 |
Frankfurt |
Frankfurt |
|
3 |
Tokyo |
Tokyo |
|
4 |
Amsterdam |
Singapore |
|
5 |
Singapore |
Amsterdam |
|
6 |
Washington, DC |
Washington, DC |
|
7 |
New York |
New York |
|
8 |
Paris |
Hong Kong |
|
9 |
Hong Kong |
Paris |
|
10 |
Los Angeles |
Los Angeles |
Fastest growing cities: H2 2026
The fastest-growing cities rankings are based on the future growth score—also measured on a scale of 1-100—of the top 200 most connected metro areas.
- Manila | 32.3
- Hong Kong | 32.2
- Amsterdam | 29.8
- Shenzhen | 27.9
- Hangzhou | 27.8
- Columbus, OH | 27.3
- Singapore | 25.9
- Cairo | 25.0
- Dallas, TX | 24.5
- Atlanta, GA | 23.7
Fastest growing cities, H2 2026 vs. H1 2026
Compared with the H1 2026 fastest growing cities rankings, the H2 2026 list has a couple newcomers, as well as a couple of cities that fell off the list. The Market Connectivity Scores are multifaceted and calculated according to nine categories of data, pulling data from multiple TeleGeography products. With all of those inputs, there is room for reshuffling as market developments around the world take shape.
Let’s take a look at a few of the strong markets on the fastest growing cities list.
Columbus
Apart from northern Virginia, Columbus, Ohio has the most data centers planned for near-term development of anywhere in the world. While power is a problem everywhere, Columbus has relatively easy access to natural gas for behind-the-meter power generation, which has greatly aided the region’s ongoing development.
Major wholesale operators like Stack, Vantage, and QTS are still expanding rapidly in Columbus, along with hyperscalers like Amazon and Meta.
Singapore
Globally, no other market comes close to the amount of subsea infrastructure planned for Singapore, with at least 17 planned cables landing there.
The drip of data center development is still slow, but holders of precious permits like DayOne, Equinix, and AirTrunk are building what they can in this restricted and high-demand market.
Dallas
The Dallas metropolitan market continues to capitalize on the need for a strong regional hub, as heavy development for AI-focused data centers taps into the abundant natural gas of the Permian Basin in West Texas. Equinix, DataBank, Stack and other operators continue to build out new sites across the Dallas metro area.
|
Fastest Growing Cities – TeleGeography’s Market Connectivity Score |
||
|
Ranking |
H2 2026 |
H1 2026 |
|
1 |
Manila |
Hong Kong |
|
2 |
Hong Kong |
Manila |
|
3 |
Amsterdam |
Columbus, OH |
|
4 |
Shenzhen |
Hangzhou |
|
5 |
Hangzhou |
Shenzhen |
|
6 |
Columbus, OH |
Singapore |
|
7 |
Singapore |
Cairo |
|
8 |
Cairo |
Daegu |
|
9 |
Dallas, TX |
Washington, DC |
|
10 |
Atlanta, GA |
Dallas, TX |
Where you can get this data
These rankings of the 10 most connected and fastest growing cities are fueled by TeleGeography’s Data Center Research Service—the most comprehensive source of intelligence on data center infrastructure and ecosystems. With the Data Center Research Service, you can:
- Access our Market Connectivity Score, a powerful tool that measures current and potential data center size for 3,000 cities worldwide
- Explore an interactive map depicting nearly 6,400 active data centers
- Discover where to access different networks, internet exchanges, or cloud providers
- View data center site profiles, including operator contact details, megawatt capacity, floor space, and vital details about the site ecosystem
- Get expert analysis of global data center market trends compiled from over 1,000 site surveys and supplemental research
- Access current and historical colocation pricing data for top global markets.
How the Market Connectivity Score works
In brief: the MCS is a tool to compare and summarize market development which can be specifically tailored to your priorities. It calculates a score for each market by averaging its relative sub-scores. These are drawn from the data categories described below. At any time, you may hit the “change weights” button, which lets you adjust how important each category is to calculating the final score.
After all, there’s no single answer to which market is the “best.” Context is critical. Don’t care about internet exchanges? Change their weight to zero. Need access to cloud infrastructure? Boost its weight to the maximum. The scores will adjust accordingly, showing the most important markets for your situation.
Data categories
The MCS analyzes nine broad categories of data, seven of which are derived directly from TeleGeography datasets. Interestingly, these indicators pull not only from the Data Center Research Service, but other TeleGeography products as well. Here, we’ll provide a brief summary of each category, its source, and how it impacts Market Connectivity Scores:
Data centers
This data group tells us how a market fares when it comes to provisioning data center infrastructure in support of the local communications market. It’s all about data center capacity in deployment and in the pipeline. Pulling from our extensive Data Center Research Service, the overall data center score is derived from aggregate market capacity in place, numbers of sites, and sites in deployment.
One of the sub-categories here is “Data Centers Planned.” The scoring here specifically tracks new data center sites that are actively in deployment. It doesn’t include expansions to existing facilities or land bank purchases; just where new buildings are under construction and due to launch within the next few years.
Internet exchanges
Internet Exchange (IX) presence and activity is a great indicator of communications market health, and one we research in the Data Center Research Service. Scores for ASNs connected and the number of IXs in the market tell us how many networks and platforms are present. These scores also let us know whether the local market is overly dependent on an incumbent operator. More networks at more peering locations indicates greater local competitiveness. One other measure in this category is the percentage of ASNs that are international. This provides an early indication of whether international carriers see the market as a valuable place to deploy.
Pricing
Pulling from our Network Pricing Database this data group gives a fundamental indicator of the cost of connecting in a market. Low scores indicate higher costs, which increase barriers to market entry and activity.
Cloud infrastructure
This score category pulls from a number of data sets in our Cloud and WAN Infrastructure Service. It tells us the extent to which cloud applications can be delivered locally. Customers access cloud services via onramps, which then give them dedicated access to platforms stored either in massive cloud zone data center constellations or in smaller local cloud zones with more limited offerings. We track all of these here. We also include CDNs in this list—the caches that allow content to be delivered locally.
Within this broader data group, we track cloud regions planned. This indicator tracks announced, but not yet operational, cloud regions. Some have much longer lag times to deployment than others.
Long-distance transport
Several TeleGeography metrics are tied into this broad category. International internet capacity and count of directly connected cities are pulled from our IP Networks research. These are great indicators of how well a given market is integrated into global networks. In some cases, this measure enforces, along with data center development, the growing or continuing significance of a market. In other cases, it may remind us that a market still has significance as a network hub despite slower growth in data center rollouts.
Next, existing and planned submarine cables are tracked in our Transport Networks research. The number of active and planned subsea cables further enforce a market’s place on wider intra-regional or intercontinental stages. Of course, landlocked cities have no use for subsea metrics, but the last components in this category—numbers of long-haul and WAN carriers present from our Cloud and WAN Infrastructure Service—make up the difference. Here we can see how robust the competition is for access to the outside world—both for local carriers and for enterprises.
Local access
This network-specific data group shows us how big the fixed broadband market is and how much of the mobile market has broadband-level access. Even if the peering and transport infrastructure is lacking in a given location, high broadband usage is a clear indicator of need for network support infrastructure. This data is drawn largely from TeleGeography’s GlobalComms Database.
Power
In today’s connectivity markets, no commodity is more precious than power. Many of the world’s most critical communication hubs are suffering from a full-blown crisis in lack of electricity to support data center, cloud, and network needs. This crisis comes at a time when governments around the world are pushing to reduce dependence on fossil fuels and increase usage of clean power, which is even more scarce. This data group in the MCS uses data from the Global Energy Monitor to rank cities by their current and planned availability of clean power.
Geography & demographics
This category provides larger macro indicators for each city that indicate relative potential for communications market development. Most of the individual measures here come directly from TeleGeography, with the exception of Global 5000 Database data, which shows us the number of major corporations with headquarters in a given city. One of the metrics here gives an intriguing view of how relatively a given city is pulled into the orbit of or independent from other hubs. The measure, “Remoteness from Other Hubs” tells us how the city’s Long-Distance Transport score compares to other cities in a 100-km radius.
Regulations & governance
This final category is derived from the World Bank’s Worldwide Governance Indicators. It provides a sense of how volatile or dependable a local operating environment may be by measuring rule of law, regulation, stability, and freedom of voice.