At Slack, our data platform processes terabytes of data each day using Apache Spark on Amazon EMR on Amazon Elastic Compute Cloud (Amazon EC2), powering the insights that drive strategic decision-making across the organization.
As our data volume expanded, so did our performance challenges. With traditional monitoring tools, we couldn’t effectively manage our systems when Spark jobs slowed down or costs spiraled out of control. We were stuck searching through cryptic logs, making educated guesses about resource allocation, and watching our engineering teams spend hours on manual tuning that should have been automated. That’s why we built something better: a detailed metrics framework designed specifically for Spark’s unique challenges. This is a visibility system that gives us granular insights into application behavior, resource usage, and job-level performance patterns we never had before. We’ve achieved 30–50% cost reductions and 40–60% faster job completion times. This is real operational efficiency that directly translates to better service for our users and significant savings for our infrastructure budget. In this post, we walk you through exactly how we built this framework, the key metrics that made the difference, and how your team can implement similar monitoring to transform your own Spark operations.
Why comprehensive Spark monitoring matters
In enterprise environments, poorly optimized Spark jobs can waste thousands of dollars in cloud compute costs, block critical data pipelines affecting downstream business processes, create cascading failures across interconnected data workflows, and impact service level agreement (SLA) compliance for time-sensitive analytics.
The monitoring framework we’re examining captures over 40 distinct metrics across five key categories, providing the granular insights needed to prevent these issues.
How we ingest, process, and act on Spark metrics
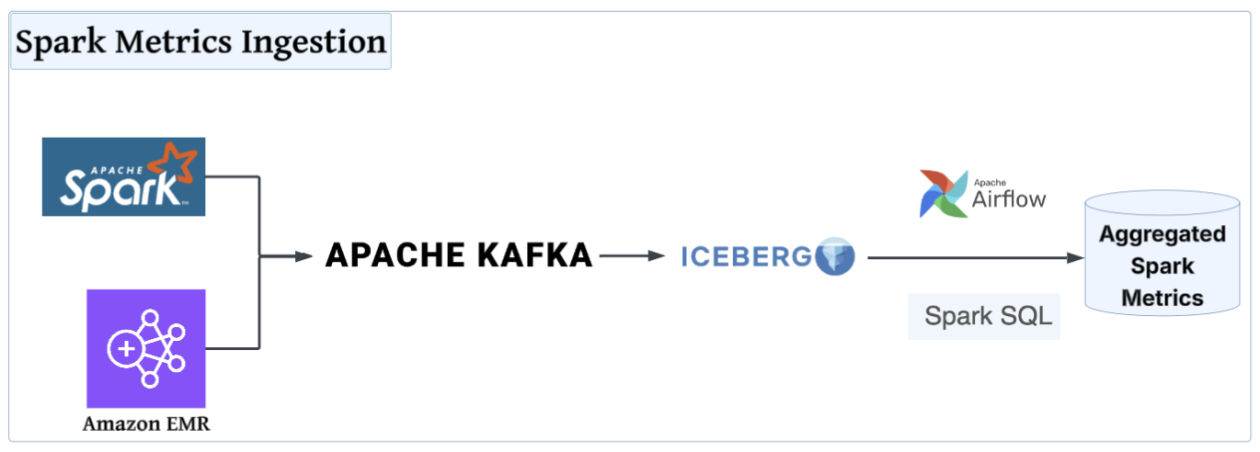
To address the challenges of managing Spark at scale, we developed a custom monitoring and optimization pipeline—from metric collection to AI-assisted tuning. It begins with our in-house Spark listener framework, which captures over 40 metrics in real time across Spark applications, jobs, stages, and tasks while pulling critical operational context from tools such as Apache Airflow and Apache Hadoop YARN.
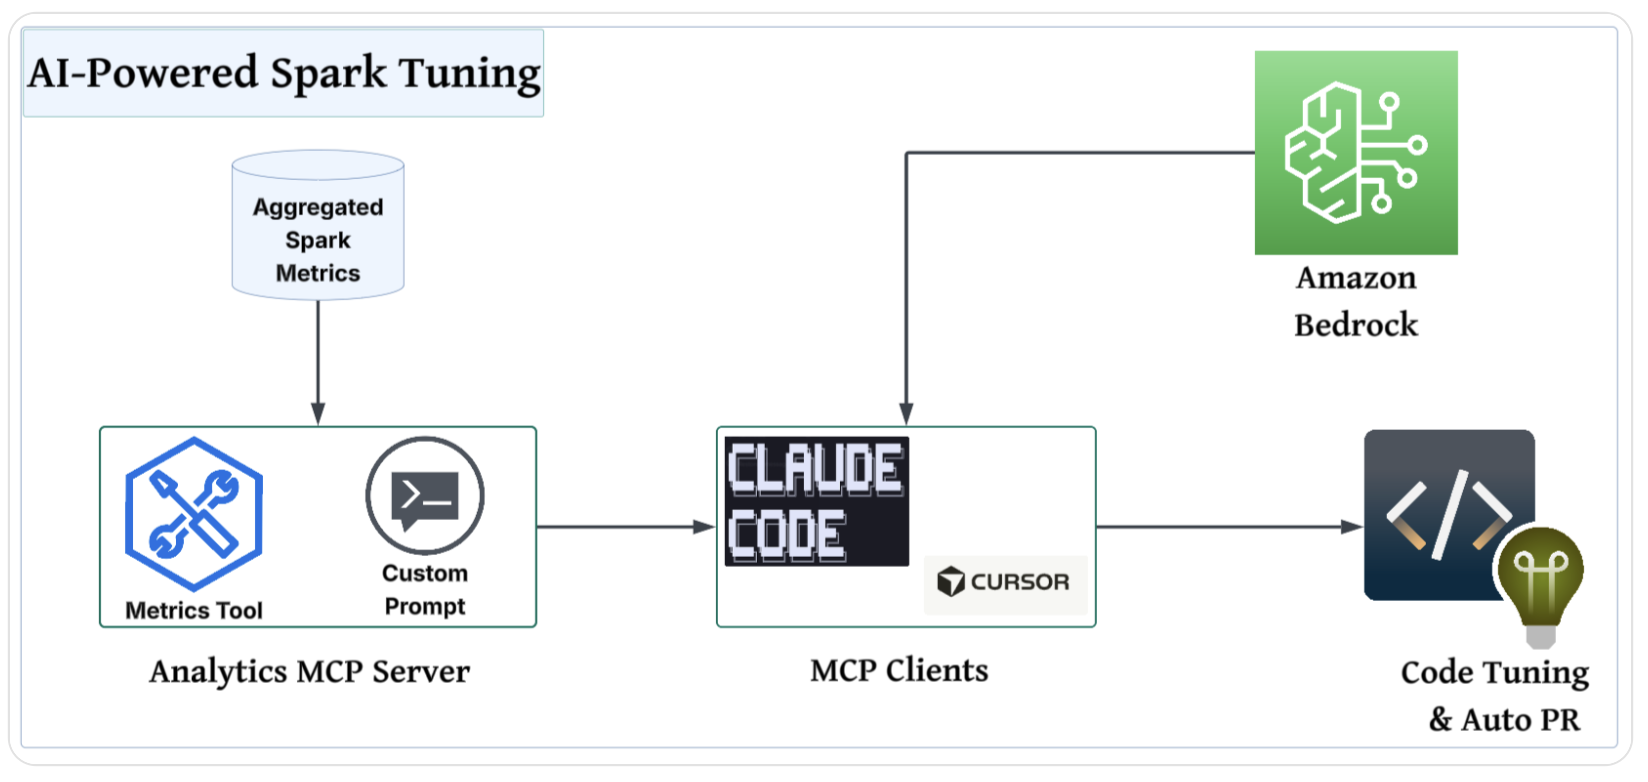
An Apache Airflow-orchestrated Spark SQL pipeline transforms this data into actionable insights, surfacing performance bottlenecks and failure points. To integrate these metrics into the developer tuning workflow, we expose a metrics tool and a custom prompt through our internal analytics model context protocol (MCP) server. This enables seamless integration with AI-assisted coding tools such as Cursor or Claude Code.
The following is the list of tools used for our Spark monitoring solution, which includes metric collection to AI-assisted tuning:
The result is fast, reliable, deterministic Spark tuning without the guesswork. Developers get environment-aware recommendations, automated configuration updates, and ready-to-review pull requests.
Deep dive into Spark metrics collection
At the center of our real-time monitoring solution lies a custom Spark listener framework that captures thorough telemetry across the Spark lifecycle. Spark’s built-in metrics are often coarse, short‑lived, and scattered across the user interface (UI) and logs, which leaves four critical gaps:
- Consistent historical record
- Weak linkage from applications to jobs to stages to tasks
- Limited context (user, cluster, team)
- Poor visibility into patterns such as skew, spill, and retries
Our expanded listener framework closes these gaps by unifying and enriching telemetry with environment and configuration tags, building a durable, queryable history, and correlating events across the execution graph. It explains why tasks fail, pinpoints where memory or CPU pressure occurs, compares intended configurations to actual usage, and produces clear, repeatable tuning recommendations so teams can baseline behavior, minimize waste, and resolve issues faster. The following architecture diagram illustrates the flow of the Spark metrics collection pipeline.

Spark listener
Our listener framework captures Spark metrics at four distinct levels:
- Application metrics: Overall application success/failure rates, total runtime, and resource allocation
- Job-level metrics: Individual job duration and status tracking within an application
- Stage-level metrics: Stage execution details, shuffle operations, and memory usage per stage
- Task-level metrics: Individual task performance for deep debugging scenarios
The following Scala example code shows the SparkTaskListener extends the class SparkListener to capture detailed task-level metrics:
Real-time streaming to Kafka
These metrics are streamed in real time to Kafka as JSON-formatted telemetry using a flexible emitter system:
From Kafka, a downstream pipeline ingests these records into an Apache Iceberg table.
Context-rich observability
Beyond standard Spark metrics, our framework captures essential operational context:
- Airflow integration: DAG metadata, task IDs, and execution timestamps
- Resource tracking: Configurable executor metrics (heap usage, execution memory)
- Environment context: Cluster identification, user tracking, and Spark configurations
- Failure analysis: Detailed error messages and task failure root causes
The combination of thorough metrics collection and real-time streaming has redefined Spark monitoring at scale, laying the groundwork for powerful insights.
Deep dive into Spark metrics processing
When raw metrics—often containing millions of records—are ingested from various sources, a Spark SQL pipeline transforms this high-volume data into actionable insights. It aggregates the data into a single row per application ID, significantly reducing complexity while preserving key performance signals.
For consistency in how teams interpret and act on this data, we apply the Five Pillars of Spark Monitoring, a structured framework that turns raw telemetry into clear diagnostics and repeatable optimization strategies, as shown in the following table.
| Pillar | Metrics | Key purpose/insight | Driving event |
|---|---|---|---|
| Application metadata and orchestration details |
|
Correlate performance patterns with teams and infrastructure to identify inefficiencies and ownership. |
|
| User-specified configuration |
|
Compare configuration as opposed to actual performance to detect over- and under-provisioning and optimizing costs. This is where significant cost savings often hide. | Spark event: |
| Performance insights |
|
This is where the real diagnostic power lies. These metrics identify the three primary stoppers of Spark performance: skew, spill, and failures. | Spark event: |
| Execution insights |
|
Understand runtime distribution, identify bottlenecks, and highlight execution outliers. | Spark event:
|
| Resource usage and system health |
|
Reveal memory inefficiencies and JVM-related pressure for cost and stability improvements. Comparing these against given configs helps identify waste and optimize resources. | Spark event:
|
AI-powered Spark tuning
The following architecture diagram illustrates the use of agentic AI tools to analyze the aggregated Spark metrics.

To integrate these metrics into a developer’s tuning workflow, we build a custom Spark metrics tool and a custom prompt that any agent can use. We use our existing analytics service, a homegrown web application that users can query our data warehouse with, build dashboards, and share insights. The backend is written in Python using FastAPI, and we expose an MCP server from the same service by using FastMCP. By exposing the Spark metrics tool and custom prompt through the MCP server, we make it possible for developers to connect their preferred assisted coding tools (Cursor, Claude Code, and more) and use data to guide their tuning.
Because the data exposed by the analytics MCP server might be sensitive, we use Amazon Bedrock in our Amazon Web Services (AWS) account to provide the foundation models to our MCP clients. This keeps our data more secure and facilitates compliance because it never leaves our AWS environment.
Custom prompt
To create our custom prompt for AI-driven Spark tuning, we design a structured, rule-based format that encourages more deterministic and standardized output. The prompt defines the required sections (application overview, current Spark configuration, job health summary, resource recommendations, and summary) for consistency across analyses. We include detailed formatting rules, such as wrapping values in backticks, avoiding line breaks, and enforcing strict table structures to maintain clarity and machine readability. The prompt also embeds explicit guidance for interpreting Spark metrics and mapping them to recommended tuning actions based on best practices, with clear criteria for status flags and impact explanations. The prompt means that the AI’s recommendations can be traced, reproduced, and actioned based on the provided data by tightly controlling the input-output flow and attempting to prevent hallucinations.
Final results
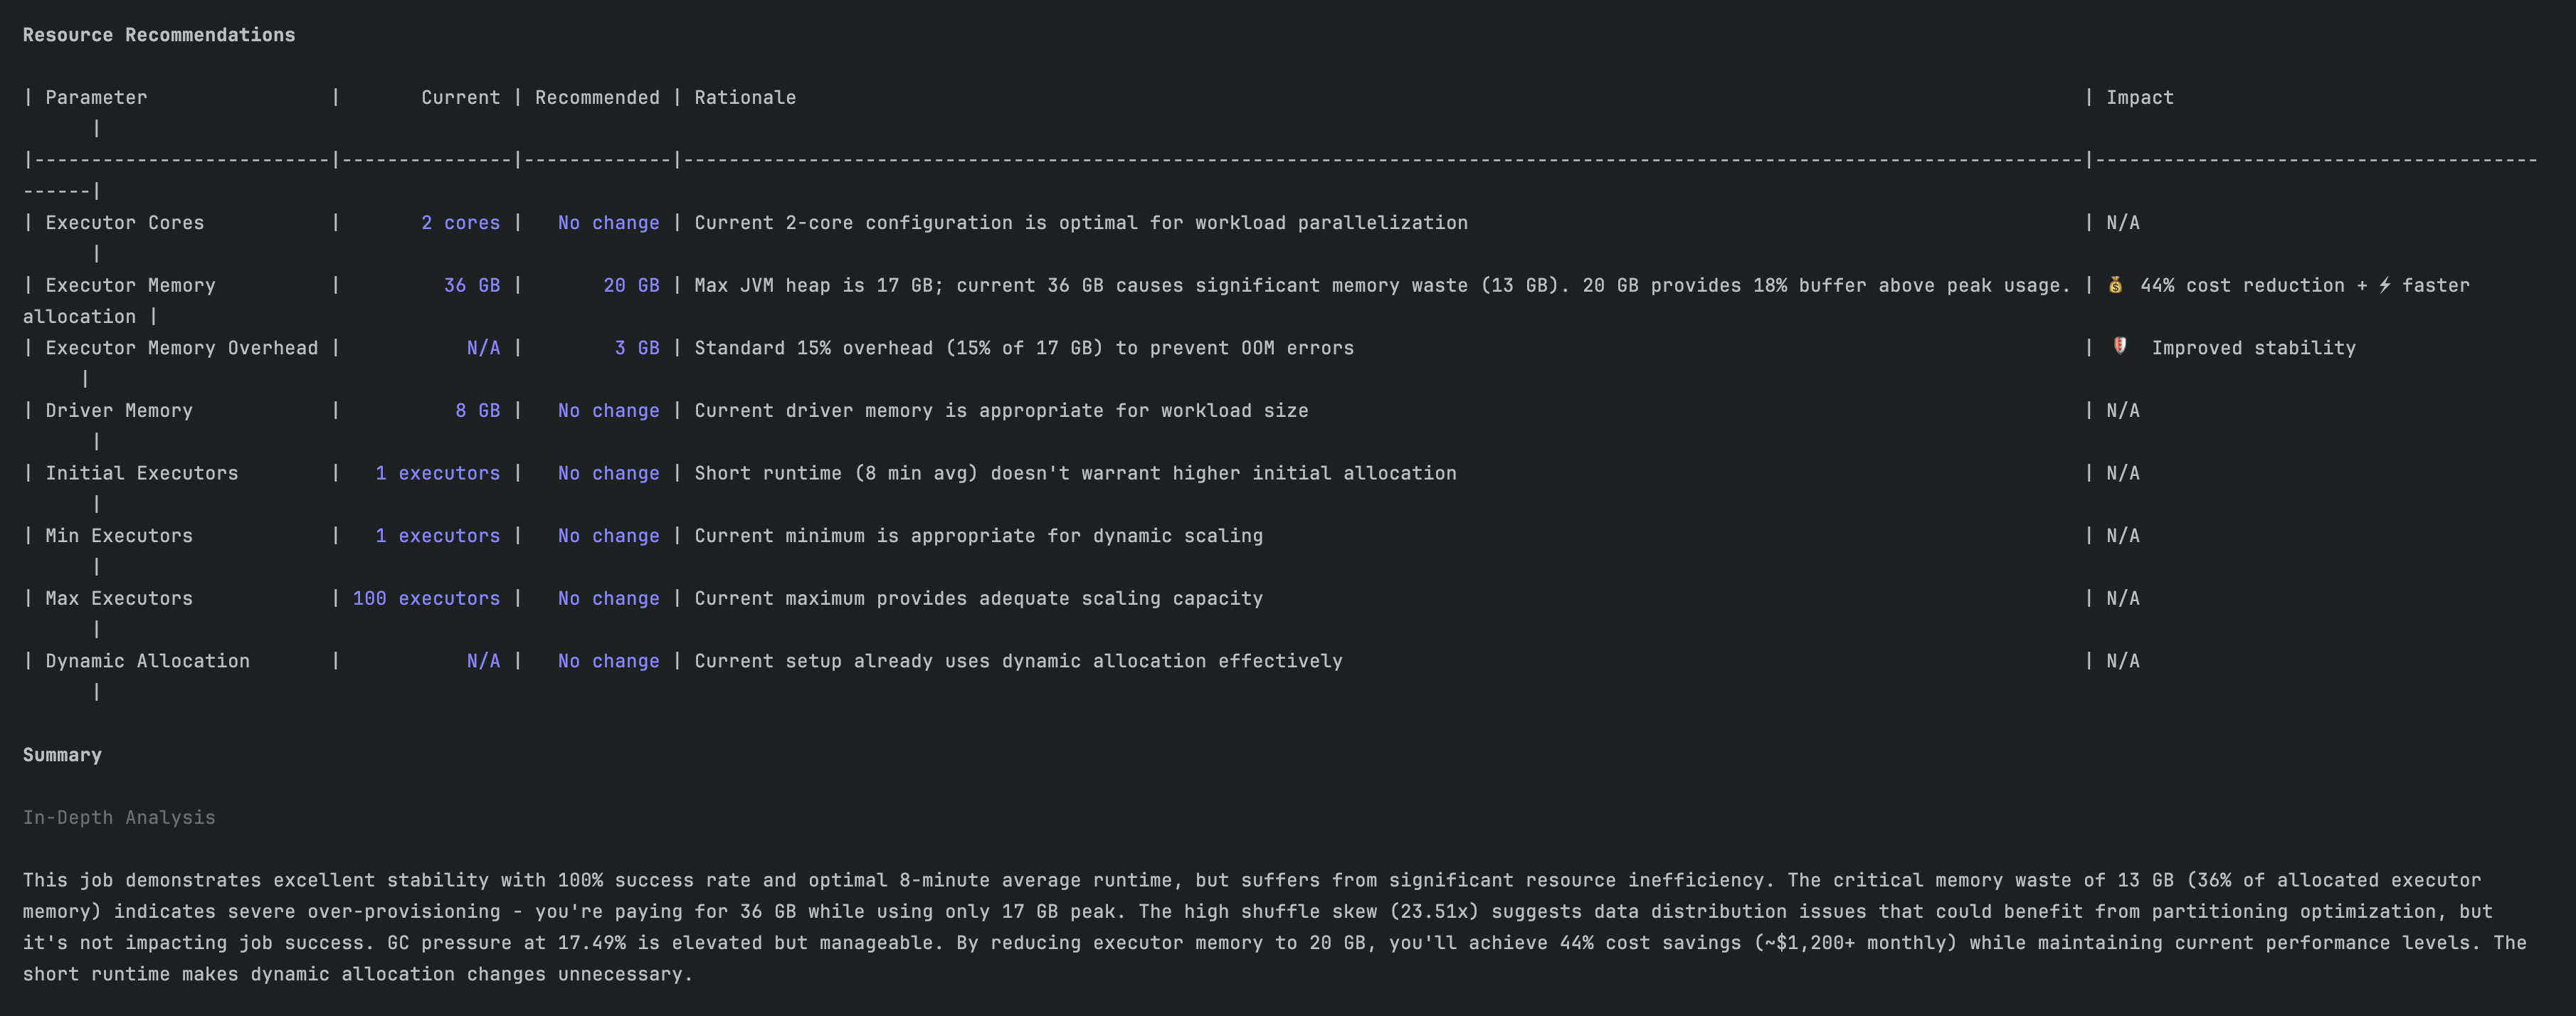
The screenshots in this section show how our tool performed the analysis and provided recommendations. The following is a performance analysis for an existing application.

The following is a recommendation to reduce resource waste.

The impact
Our AI-powered framework has fundamentally changed how Spark is monitored and managed at Slack. We’ve transformed Spark tuning from a high-expertise, trial-and-error process into an automated, data-backed standard by moving beyond traditional log-diving and embracing a structured, AI-driven approach. The results speak for themselves, as shown in the following table.
| Metric | Before | After | Improvement |
|---|---|---|---|
| Compute cost | Non-deterministic | Optimized resource use | Up to 50% lower |
| Job completion time | Non-deterministic | Optimized | Over 40% faster |
| Developer time on tuning | Hours per week | Minutes per week | >90% reduction |
| Configuration waste | Frequent over-provisioning | Precise resource allocation | Near-zero waste |
Conclusion
At Slack, our experience with Spark monitoring shows that you don’t need to be a performance expert to achieve exceptional results. We’ve shifted from reacting to performance issues to preventing them by systematically applying five key metric categories.
The numbers speak for themselves: 30–50% cost reductions and 40–60% faster job completion times represent operational efficiency that directly impacts our ability to serve millions of users worldwide. These improvements compound over time as teams build confidence in their data infrastructure and can focus on innovation rather than troubleshooting.
Your organization can achieve similar outcomes. Start with the basics: implement comprehensive monitoring, establish baseline metrics, and commit to continuous optimization. Spark performance doesn’t require expertise in every parameter, but it does require a strong monitoring foundation and a disciplined approach to analysis.
Acknowledgments
We want to give our thanks to all the people who have contributed to this incredible journey: Johnny Cao, Nav Shergill, Yi Chen, Lakshmi Mohan, Apun Hiran, and Ricardo Bion.
About the authors

