
Today’s data centers rely on a variety of tools to provide enhanced visibility and observability of critical application traffic and traffic flow details. Utilizing switch-based telemetry capabilities is an extremely popular approach, but it’s often the case that packet details or granular traffic filtering are desired; thus, a complementary solution is required. Cisco Nexus Dashboard Data Broker is the perfect solution to ingest Switched Port Analyzer (SPAN) and/or Test Access Point (TAP) traffic, apply filters and header modifications, provide packet deduplication, and then redirect traffic to monitoring and other tools such as intrusion prevention systems (IPS) and security incident and event management (SIEM) solutions.
Solution architecture
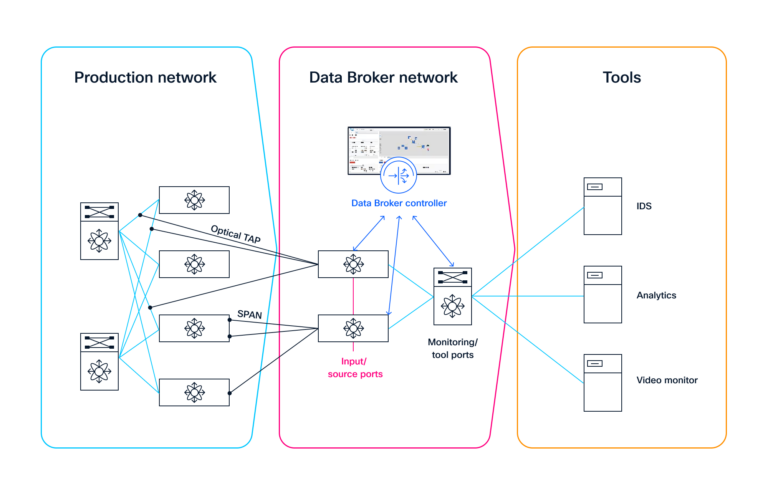
The Nexus Dashboard Data Broker includes a centralized management graphical user interface (GUI), deployed today on one or more Linux hosts for high availability, with a plan for support on unified Nexus Dashboard. It uses Cisco Nexus 9000 Series Switches, which require the cost-effective data broker license (NX-OS Essentials), to unlock this functionality. For scale-out requirements, multiple SPAN/TAP destination switches can be aggregated into a single topology. This topology is managed by the centralized data broker solution, which directs traffic to a data broker switch (see Figure 1) for distribution to the desired tools in your environment.
For switches that support Nexus Dashboard Data Broker, any interface can be used for your production network connection ports as well as your connections to the required tools (any port, any functionality). Interface speeds from 1 Gbps to 400 Gbps are supported, ensuring adequate bandwidth and connectivity options for your packet brokering needs, which meet today’s demanding data center growth.
Low-touch configuration
Identifying and configuring the desired traffic sets and destination interfaces is an underlying core requirement of the Data Broker deployment. Data Broker helps automatically configure both your data center and campus devices, regardless of the existence of a centralized controller. Data Broker natively integrates with Cisco Application Centric Infrastructure (ACI) data center fabrics, Cisco Catalyst Center-based campus fabrics, as well as standalone Nexus and Catalyst switches. This eliminates the manual configuration burden, ensuring accurate solution configuration and rapid turn-up. The operational benefit of only requiring a single GUI for deploying the required switch configuration enhances the simplicity of a Data Broker deployment.
Customers who require packet brokering for both data center and campus environments can rest assured that the single Data Broker interface will simplify the required configurations for their heterogeneous environments.
Resiliency and redundancy
Relying on Data Broker for always-on packet visibility is a reality with the mechanisms included for ensuring maximum solution uptime:
- The various service nodes and data broker switches that make up the solution topology are tracked by Data Broker and, equally important, are bypassed if Data Broker detects either a service node issue or packet broker switch interface issue.
- Data Broker supports symmetric hashing and load-balancing, allowing for the distribution of traffic across multiple instances of a specific tool.
- If there is an issue with the aggregation switch, Data Broker can automatically program a backup path to ensure that the desired traffic continues to be captured.
- Data Broker incorporates a fail-safe mechanism, allowing for direct communication between ingress and egress interfaces in the event of a service node failure.
The above features ensure that any failures within the topology are addressed dynamically, requiring no human intervention and providing maximum uptime for continuous visibility and observability.
Packet deduplication
Collecting SPAN and/or TAP from multiple sources yields the risk of duplicate traffic being received by the Data Broker switches. The deduplication feature, supporting both Transmission Control Protocol (TCP) and User Datagram Protocol (UDP), was added in NX-OS 10.4(1)F, allowing for streamlined packet broker deployment. The deduplication function can be performed in-line on the Data Broker switch(es) or out-of-line through one or more dedicated Data Broker switches. An important characteristic is that the deduplication function is hardware-accelerated, guaranteeing consistent solution performance and scalability.
An additional aspect of deduplication is the ability to right-size tools to accommodate the amount of post-deduplication traffic, as opposed to redundant, duplicated traffic.
Visibility of encapsulated traffic
Packet brokering tools are often deployed in environments that have one or more packet encapsulation technologies, for example, multi-protocol label switching (MPLS), virtual extensible LAN (VXLAN), and generic routing encapsulation (GRE). An effective tool needs to be able to view the actual endpoint-to-endpoint traffic within the encapsulated packets, thus packet-header and label-stripping capabilities are critical. Data Broker allows for header and label stripping for the aforementioned technologies, in addition to Q-in-Q and Cisco Encapsulated Remote Switched Port Analyzer (ERSPAN) traffic, providing best-in-class visibility for your data center, campus, and edge traffic.
This has the added benefit of less processing required by analysis tools in the environment, resulting in bandwidth and cost savings.
NetFlow generation
Analysis tools have the capability of processing SPAN and TAP traffic redirected from Data Broker, but there are numerous tools, such as Splunk, that benefit from receiving either NetFlow or sFlow details for the desired traffic. Data Broker can generate either NetFlow or sFlow associated with SPAN or TAP traffic, allowing for compatibility with a greater range of tools. Coupled with the deduplication feature, you are assured of streamlined, efficient flow visibility in addition to packet visibility for your data center and other traffic in your network.
Cisco Nexus Dashboard
The Cisco Nexus Dashboard has evolved to incorporate centralized NX-OS fabric management, proactive day-2 operations, and fabric orchestration in a simplified, intuitive GUI. The upcoming Nexus Dashboard 4.2 release will incorporate Data Broker, finalizing the simplified management and operational approach for any Cisco fabric type. Customers who prefer a separate Linux-based Data Broker deployment will continue to have that option.
Step into the future of traffic analysis
Achieving comprehensive traffic visibility without overwhelming your analysis tools is the core promise of Cisco Nexus Dashboard Data Broker. By delivering a single, intelligent platform, it simplifies operations with a unified view of your data center and campus, lowers total cost of ownership through hardware-powered deduplication, and guarantees uptime with built-in, automated resiliency. This ensures your monitoring tools get the exact data they need—and nothing they don’t.
Ready to explore how these capabilities can transform your network operations? Dive deeper by reviewing the complete Nexus Dashboard Data Broker data sheet or explore specific configuration examples for practical guidance. When you are ready to see it in action, contact your Cisco or channel partner account team for a personalized demo.