

Preparation of BSLBs
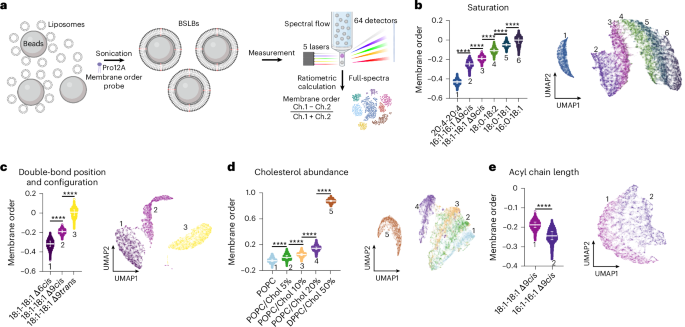
1,2-Diarachidonoyl-sn-glycero-3-phosphocholine (20:4-20:4 (DAPC)), 1,2-di-(9Z-octadecenoyl)-sn-glycero-3-phosphocholine (18:1-18:1 Δ9cis (DOPC)), 1,2-dipetroselenoyl-sn-glycero-3-phosphocholine (18:1-18:1 Δ6cis), 1,2-dielaidoyl-sn-glycero-3-phosphocholine (18:1-18:1 Δ9trans), 1,2-dipalmitoleoysl-sn-glycero-3-phosphocholine (16:1-16:1 Δ9cis), 1,2-dipalmitelaidoyl-sn-glycero-3-phosphocholine (16:1-16:1 Δ9trans), 1-stearoyl-2-oleoyl-sn-glycero-3-phosphocholine (18:0-18:1), 1-stearoyl-2-linoleoyl-sn-glycero-3-phosphocholine (18:0-18:2), 1-palmitoyl-2-oleoyl-sn-glycero-3-phosphocholine (16:0-18:1 (POPC)) and cholesterol were from Avanti Polar Lipids. As a first step, 10 µl of each lipid at 25 mg ml−1 (in chloroform) was dried under a gentle stream of nitrogen to form a thin lipid film. The dried film was rehydrated in 1 ml of SLB buffer (150 mM NaCl, 10 mM HEPES, pH 7.4), vortexed briefly and sonicated using a tip sonicator (power, 3; duty cycle, 40%) for 10 min to generate small unilamellar vesicles (SUVs). To form BSLBs, 45 µl of the SUV solution was mixed with 5 µl of silica beads (Bangs Labs) in a final volume of 500 µl SLB buffer. The mixture was bath-sonicated at room temperature for 30 min to facilitate bilayer formation on the bead surfaces. The resulting lipid-coated beads were washed three times with SLB buffer to remove unbound lipids. NR12S and Pro12A were synthesized as described previously9,10. For flow cytometry analysis, beads were incubated with the membrane order probes Pro12A or NR12S (final concentration, 250 nM) for 1 min in flow cytometry tubes immediately prior to acquisition on a Cytek Aurora spectral flow cytometer (5 lasers, 64 channels). For imaging, beads were plated in an 18-well glass-bottom chamber (ibidi) and excited with a 405-nm laser using a Zeiss LSM 780 confocal microscope equipped with 32-channel spectral detectors.
Drug treatments on CEM cells
CEM cells (ATCC, CRL-2265) were cultured in RPMI 1640 medium (Sigma-Aldrich) supplemented with 10% FBS (Sigma-Aldrich) under standard conditions. The following compounds were used for drug treatment experiments: CK-666 (5 µg ml−1), latrunculin B (1 µg ml−1), methyl-β-cyclodextrin (12 µg ml−1), sphingomyelinase (1/100 dilution of 25 units), oseltamivir phosphate (40 µg ml−1), swainsonine (1 µg ml−1), digitonin (5 µg ml−1) and valinomycin (25 µM) (all from Sigma-Aldrich), and CCCP (20 µM) (Thermo Fisher). For each condition, 3 × 10⁵ cells were used. If not stated otherwise, all treatments were performed in full medium at 37 °C for 30 min–1 h. Following incubation, cells were washed three times with PBS. Cell viability was assessed using BD Horizon Fixable Viability Stain 660 (FVS660, Live/Dead), applied for 15 min at room temperature, followed by two PBS washes. For membrane order analysis, cells were stained with Pro12A dye (0.6 µl of 100 µM dye in 300 µl PBS for 300,000 cells) for 1 min directly in the flow cytometry tubes immediately before the acquisition. For mitochondrial depolarization measurements, JC-1 dye (Thermo Fisher) was incubated with the cells for 30 min either prior to or during drug treatment. For CCCP treatments, JC-1 (0.5 µl of 250 µM dye in 500 µl medium for 300,000 cells) was added during the last 5, 15 or 30 min of drug exposure, while for Digitonin, JC-1 was added during the final 5 min of treatment. Cells were washed twice prior to Live/Dead staining. For membrane potential measurements with CV1 dye (CytoCybernetics), cells were incubated for 15 min in varying ratios of high-potassium buffer (138 mM KCl, 2 mM NaCl, 2 mM CaCl2, 20 mM HEPES, pH 7.5) and low-potassium buffer (2 mM KCl, 138 mM NaCl, 2 mM CaCl2, 20 mM HEPES, pH 7.5), followed by treatment with valinomycin for 5 min. The Nernst potential for potassium was calculated by the equation:
$${E}_{{\rm{K}}}=\frac{-{RT}}{F}\mathrm{ln}\frac{140\,\mathrm{mM}}{[{{\rm{K}}}_{\mathrm{out}}]}$$
(1)
where R is the gas constant, T is the temperature, F is Faraday’s constant and [Kout] is the concentration of potassium in the external solution, assuming an intracellular potassium concentration of 140 mM. Cells were then stained with CV1 (0.5 µl of 50 µM dye in 300 µl PBS for 300,000 cells) for 1 min immediately prior to acquisition. For spectral imaging, cells were plated in an 18-well glass-bottom chamber and imaged using a Zeiss LSM 780, as described previously for Pro12A11. Cells with JC-1 were excited with a 488-nm laser, and 19 detectors were set, ranging between 494 and 665 nm with 9-nm intervals. Normalized ratios ((monomer − aggregates)/(monomer + aggregates)) were calculated using wavelengths of 539 nm (monomers) and 592 nm (aggregates). For imaging of CV1, cells were excited with wavelengths of 633 nm and collected between 632 and 694 nm.
Drug treatments on PBMCs
PBMCs (covered by ethical permit Dnr 2025-01255-01, 2025-02-20) were isolated from 45 ml of buffy coat obtained from healthy donors. The buffy coat was diluted 1:1 with PBS and evenly distributed into two 50-ml Falcon tubes. After thorough mixing with a serological pipette, 30 ml of the diluted sample was carefully layered over 15 ml of Ficoll-Paque (Sigma-Aldrich) in three separate 50-ml tubes. Samples were centrifuged at 400g for 25 min without applying the brake. The PBMC layer was collected and transferred into fresh tubes, followed by two PBS washes (300g, 5 min, brake on). After the final wash, cells were resuspended in 20 ml PBS, filtered through a 70-µm cell strainer (Thermo Fisher), and centrifuged at 200g for 10 min. The supernatant was discarded, and the cell pellet was resuspended in cryopreservation medium (90% FBS, 10% DMSO). Cells were aliquoted (1 ml per vial) and stored at –150 °C until use.
For experiments, frozen PBMCs were thawed by gradual addition of a 10-fold volume of prewarmed RPMI 1640 medium supplemented with 10% FBS, followed by centrifugation at 400g for 6 min. Cells were processed in Eppendorf tubes at a final concentration of 6 × 10⁵ cells per condition. For mitochondrial depolarization assays, cells were first incubated with JC-1 dye for 30 min at 37 °C, followed by two PBS washes. Cells were then treated with CCCP for 5 min to induce mitochondrial depolarization and washed twice with PBS. For membrane order analysis, cells were treated with sphingomyelinase (Sigma-Aldrich) for 1 h at 37 °C and subsequently washed twice with PBS. While antibody staining was performed after treatments and JC-1 labelling for mitochondrial depolarization, it was done before Pro12A or/and CV1 labelling.
Following treatments, cells and their untreated controls were used to prepare both single-stained controls and multicolour antibody panels for spectral flow cytometry. Antibody titrations were optimized based on staining index calculations. Each sample was either unstained, stained with a single antibody or probe (for spectral unmixing) or with a full antibody cocktail together with probe(s) in staining buffer (Thermo Fisher). Staining was performed at 4 °C in the dark for 30 min, followed by two PBS washes. Cells were then resuspended in 500 µl PBS, and viability was assessed by adding 1 µl of a Live/Dead dye (1:100 dilution), incubating for 15 min at room temperature in the dark, followed by two final PBS washes. Cells were then resuspended in 300 µl PBS in flow tubes for acquisition.
For Pro12A-only experiments, PBMCs were stained with the following antibodies: anti-human CD3-PerCP-Cy5.5 (clone SK7, BioLegend), CD56-PerCP-eFluor 710 (clone CMSSB, Thermo Fisher), CD4-NovaFluor Yellow 660 (clone SK3, Thermo Fisher), CD197 (CCR7)-PE-Vio770 (clone REA108|TG8, Miltenyi Biotec), CD14-APC (clone M5E2, BioLegend), CD19-Alexa Fluor 647 (clone HIB19, BioLegend), CD11c-APC-R700 (clone 3.9, BD Biosciences), CD45RA-APC-H7 (clone HI100, BD Biosciences), CD8a-APC-Fire 810 (clone SK1, BioLegend) and Fixable Viability Stain 570 (BD Biosciences). For JC-1-only and Pro12A–JC-1 combination experiments, the following antibodies were used: CD3-PerCP-Cy5.5, CD56-PerCP-eFluor 710, CD4-NovaFluor Yellow 660, CD197 (CCR7)-PE-Vio770, CD14-APC, CD11c-APC-R700, CD45RA-APC-H7, CD8a-APC-Fire 810 and Fixable Viability Stain 660 (BD Biosciences). For CV1-only and Pro12A–JC-1–CV1 combination experiments, the antibody panel included: CD56-PerCP-eFluor 710, CD19-Alexa Fluor 647, CD45RA-APC-H7 and CD8a-APC-Fire 810.
PBMCs from individuals with atherosclerosis
This study was approved by the Lokman Hekim University Scientific Research Ethics Committee (approval number 2024/46; approval date 30 January 2024) and by Ethics Review Authority Stockholm (Dnr 2025-02560-01, 2025-04-11). Written informed consent was received from donors prior to the study. All procedures involving human participants adhered to the ethical principles outlined in the 1964 Helsinki Declaration and its subsequent amendments or equivalent ethical standards. PBMC samples were obtained from patients with angiographically confirmed coronary artery disease, but without prior myocardial infarction, as part of the inclusion criteria. Sex- and age-matched healthy subjects had no known cardiovascular disease or drug treatment for it, had never smoked, had no history of diabetes and had no family history of cancer. Whole blood from 38 patients and 26 healthy controls was drawn into EDTA tubes (Becton Dickinson) and PBMCs were isolated immediately. No statistical methods were used to predetermine sample sizes. The samples were not randomized, and data collection and analysis were not performed blind to the conditions of the experiments to be able to measure the same number of healthy and patient material on each day. No donors were excluded. Peripheral blood was diluted 1:1 with 1× DPBS and carefully layered over an equal volume of Ficoll-Paque solution in a 50-ml conical tube, tilted at ∼45°, to maintain phase separation. The tubes were centrifuged at 400g for 30 min at room temperature with minimal acceleration and no brake to preserve interface integrity. The mononuclear cell layer (buffy coat) was collected, washed sequentially with 1× DPBS and IMDM medium (Thermo Fisher), and centrifuged at 300g for 10 min between washes. After the final wash, cells were cryopreserved at 1 × 10⁶ cells per cryovial in freezing medium (90% FBS + 10% DMSO). The cryovials were cooled at a rate of 1 °C min−1 in a Mr Frosty and stored overnight at −86 °C. All vials were subsequently transferred to liquid nitrogen until analysis. The handling of the PBMCs and the analysis pipeline for membrane order and mitochondrial depolarization with Pro12A and JC-1 is described above.
SBC measurements and analysis
Spectral flow cytometry data obtained with a Cytek Aurora (Supplementary Data 1) were analysed using FCS Express 7 (DeNovo Software), and downstream computational analyses were conducted using Python-based pipelines. Spectral unmixing was performed within FCS Express using unstained, autofluorescence for lymphocytes and monocytes, single-stained controls for each fluorochrome, and probes to accurately resolve signal overlap across channels. Spectral signatures were carefully curated and reviewed to minimize spillovers and maintain optimal separation between fluorochromes.
To identify the optimal fluorescence channel pair for separating experimental conditions, we computed ratiometric values for all dual-channel combinations. Each pair was evaluated using the Kolmogorov–Smirnov statistic and the absolute difference in median ratios. An overall score combining both metrics was used to rank channel pairs, with adjustments for high intragroup variance. The top-ranking pair was selected as the most discriminative together with excitation/emission properties of the probes. For BSLBs stained with Pro12A or NR12S, V1–V9 (428–598 nm) and YG2–YG6 (598–697 nm) channels were used, respectively. For cellular data, Pro12A emission was captured in V1–V7 (428–542 nm), JC-1 in B3–B5 (542–598 nm) and CV1 in B7–R5 (661–738 nm). When Pro12A and JC-1 were coincubated, V1–V5 (428–508 nm) were selected for membrane order quantification. When all probes were combined (Pro12A, JC-1, CV1), V1–V5 were used for Pro12A and B9–R5 (697–738 nm) for CV1. ROUT 1% outlier was applied to eliminate instrument-related erroneous or disproportionately large values. Gating strategies for all conditions, including singlet discrimination, avoiding internalized probes, viability gating, and major immune lineage identification, are detailed (Supplementary Figs. 10–15).
To explore high-dimensional spectral features and visualize population-level differences, UMAP was used for dimensionality reduction. Raw fluorescence intensity values were first normalized on a per-cell basis by dividing each channel’s value by the maximum intensity across all channels for that cell. This per-cell normalization preserved the relative spectral composition while mitigating absolute intensity variability. The intensities were then normalized using StandardScaler (scikit-learn), transforming each feature to have zero mean and unit variance. UMAP was implemented using the umap-learn package with parameters tuned to balance global and local structure preservation (for example, n_neighbors, min_dist). These parameters were chosen to maintain separation between biologically meaningful subpopulations while preserving finer structure in the data. For classification and predictive modelling tasks, we utilized Extreme Gradient Boosting (XGBoost) via the xgboost Python library. Prior to modelling, input data were scaled using StandardScaler and labels were numerically encoded using LabelEncoder (scikit-learn). Bayesian hyperparameter optimization was conducted using the skopt package (Bayesian optimization with Gaussian Processes), with search space definitions spanning key XGBoost hyperparameters (for example, learning_rate, n_estimators, max_depth, subsample, colsample_bytree, reg_alpha, reg_lambda, gamma, min_child_weight). Model performance was evaluated using stratified k-fold cross-validation (typically 10-fold; 5-fold for small sample sets), with classification accuracy and confusion matrices.
scRNA-seq of biophysically selected PBMCs
PBMC samples (four atherosclerosis and four sex- and age-matched healthy controls (A. Healthy)) were processed for scRNA-seq using the 10x Genomics Chromium Single Cell 3′ v.4 platform (Supplementary Data 2), following the manufacturer’s protocol. Briefly, after thawing and washing, cells were resuspended in PBS containing 0.04% BSA, counted and assessed for viability. Cell suspensions were loaded into the Chromium Controller to generate gel bead-in-emulsions, followed by reverse transcription, cDNA amplification and library construction using the Single Cell 3′ v.4 Reagent Kit. Final libraries were quality-checked using an Agilent Bioanalyzer and quantified by quantitative polymerase chain reaction. Sequencing was performed on an Illumina NovaSeq X Plus system (NovaSeq X Series Control Software v.1.2.2.48004) using a 151 nucleotide (nt) (read 1) – 10 nt (index 1) – 10 nt (index 2) – 151 nt (read 2) configuration on a ‘25B’ mode flow cell.
Sequencing data were processed with Cell Ranger v.9.0.1 using the GRCh38-2024-A reference genome to generate filtered gene-barcode matrices. Downstream analysis was conducted in R v.4.4.3 using the Seurat v.5.2.1 pipeline26. Briefly, standard quality control excluded cells with >20% mitochondrial content or <5% ribosomal gene expression. Genes such as MALAT1, mitochondrial (MT-), ribosomal (RPS, RPL), and haemoglobin (HB) genes were also excluded. Sample-specific expected doublet rates (ranging from 1.2% to 7.2%) were applied using DoubletFinder to identify and exclude potential doublets. The final dataset was normalized, scaled and subjected to PCA and UMAP for dimensionality reduction, followed by graph-based clustering using the Louvain algorithm and GSEA-informed cell-type prediction. To focus on immune dynamics, we specifically selected T cells and redefined identities based on disease condition (Atherosclerosis versus A. Healthy). Differential gene expression analysis was performed using the Wilcoxon rank-sum test with conservative filtering (logfc.threshold = 0.25, min.pct = 0.15), identifying genes significantly up- or downregulated in the disease context. These gene sets were analysed for pathway enrichment using the GO Biological Process 2023 database via enrichr. Enrichment results were filtered for pathways containing keywords relevant to lipids and mitochondria and visualized with −log10(P value) bar plots to highlight condition-specific changes in T-cell biology.
Mass spectrometry of biophysically selected PBMCs
We performed direct infusion shotgun lipidomics analysis on selected atherosclerosis (n = 4) and sex- and age-matched healthy control (n = 4) samples, using the same donor material as for the scRNA-seq analysis. Prior to lipidomics, primary human T cells were isolated from PBMCs via negative magnetic selection using the MojoSort Human CD3 T Cell Isolation Kit (BioLegend), following the manufacturer’s protocol. The resulting cell populations exhibited >90% purity. Cells were counted using a BioRad TC20 cell counter and assessed for viability with trypan blue staining. Subsequently, cells were washed twice with PBS, followed by a final wash with 140 mM ammonium formate. Cell pellets were then snap-frozen and stored −80 °C until the analysis. Prior to sampling, the cells were rapidly thawed and lysed using methanol:H2O 9:1 v/v (0.1% formic acid), targeting a final cell concentration of 1000 cells µl−1 in each sample. The cell lysates were centrifuged for 1 min at 8,000 r.p.m., and the supernatant was directly analysed by immersing the direct infusion probe27 in the solvent. The electrospray voltage was directly applied on the steel capillary and was set to 2,150 V. Mass spectrometry was performed in positive-ion mode on an Orbitrap IQ-X (Thermo Fisher Scientific) instrument where the AGC target was 40% and scans were acquired at 240,000 resolution (at m/z 200) in the mass range of m/z 250–1,200. For each measurement, a 1-min-long direct infusion was performed, corresponding to 120 individual mass spectra on average. The acquired RAW data files were converted to .mzML using MSConvertGUI (ProteoWizard, v.3.0.22285). Analytes were identified based on accurate mass match (3 ppm tolerance) to our in-house library using custom-made MATLAB scripts and the total-ion-current-normalized intensity of molecular features were extracted from each spectrum and averaged through all scan events. Next, the identities of detected molecules were confirmed using tandem mass spectrometry measurements on pooled samples. Specifically, we pooled equal volumes of all four control and all four atherosclerotic samples and then performed higher-energy collisional dissociation fragmentation using normalized collisional energies of 30, 40 and 50. All tandem mass spectrometry spectra were manually curated for structural annotation, and in the case of multiple adduct forms of the same molecular feature, only the highest intensity one was used for further data analysis. Sparse partial least squares (PLS) discriminant analysis was performed to identify features distinguishing between atherosclerosis and healthy T-cell lipidomes. Lipid intensity values were standardized first and the top 30 discriminative features were selected using univariate analysis of variance (ANOVA) (SelectKBest, f_classif). PLS discriminant analysis was conducted using two components, and the explained variance per component was calculated. Analyses were conducted using Python’s scikit-learn and matplotlib libraries.
Reporting summary
Further information on research design is available in the Nature Portfolio Reporting Summary linked to this article.