

Your dbt project runs 80 models every night. The warehouse bill doubled last quarter. Model performance varies widely, and the effects of the most recent optimizations are unclear. Finance asks which team is responsible. You open the query history and see… 80 identical rows labeled ‘Databricks Dbt.’ Good luck.
With Query Tags (now in Public Preview), data teams can now benefit from out-of-the-box auto-injected tags, such as dbt_model_name, which enrich every run. You can also attach your own custom tags — team, cost center, environment, anything — to every query your pipeline generates.
Tags are recorded in system.query.history, making cost attribution, performance debugging, and workload monitoring a simple SQL query away (full details in the documentation).
This blog walks through a complete, open-source dbt project that demonstrates Query Tags end-to-end: from configuration to cost attribution dashboards. Everything described here is available as a GitHub repository you can clone and deploy to your own workspace, or just ask Genie.
How dbt-databricks integrates with Query Tags
The dbt-databricks adapter (version 1.11+) supports Query Tags natively. There are three levels at which tags can be applied, each building on the previous:
Auto-injected tags
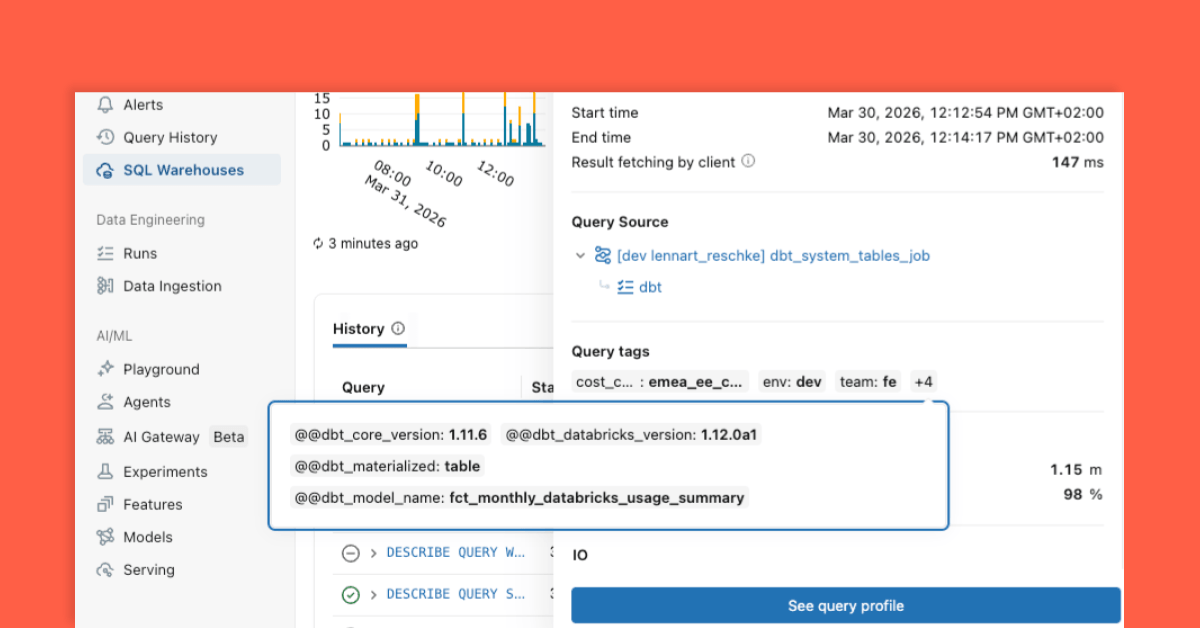
In addition to your custom tags, dbt-databricks automatically injects metadata about each model execution:
|
Tag |
Example value |
Description |
|
@@dbt_model_name |
fct_daily_usage_by_sku |
The dbt model being executed |
|
@@dbt_materialized |
table |
Materialization strategy (table, view, incremental, metric_view) |
|
@@dbt_core_version |
1.11.6 |
dbt-core version |
|
@@dbt_databricks_version |
1.12.0a1 |
dbt-databricks adapter version |
These auto-tags mean you get per-model visibility with zero configuration — the adapter does it for you.
Profile-level tags
The simplest approach: add a query_tags field to a specific target in your dbt profile. Every query in the project inherits these tags automatically.
For example, this single line tags every query with four dimensions: who owns it (team), where the cost goes (cost_center), which pipeline it belongs to (project_name), and what environment it runs in (env).
Model-level tags
For more granular attribution, you can supply tags on specific models in dbt_project.yml or model configuration in its sql definition.
Model-level tags merge with profile-level tags. If both define the same key, the model-level value takes priority.
Where tags appear – system.query.history
After running dbt run, every SQL statement appears in system.query.history with the query_tags column populated as a MAP
This returns every tagged query from the last 7 days, with the custom and auto-injected tags extracted into individual columns — ready for aggregation.
You can also find the Query Tags for the query you ran in the Query History UI or the SQL Warehouse Monitoring UI.

On the bottom right of the Query Profile, you will see the Query Tags you defined, providing you with all information necessary at glance.

Cost attribution with Query Tags
Query Tags enable granular usage attribution to be determined directly via SQL queries, eliminating the need for manual log analysis or splitting warehouse resources.
Which dbt models consume the most warehouse resources?
You can answer this two ways: ask Genie in plain language for ad-hoc exploration or write the SQL yourself for a repeatable, dashboard-ready result. Both read from the same system.query.history data.
Option 1: Genie

Genie writes and runs the equivalent query, and you keep drilling in follow-up questions without touching any SQL.
Option 2: SQL
Either path returns the same picture. In our reference project, the four mart tables (materialized as table) dominate compute time, while staging views and metric views are near-instantaneous. This immediately tells you where optimization effort should focus.

Building a self-monitoring dashboard
Our reference project includes an AI/BI dashboard that queries system.query.history filtered by the project’s own query tags. The result: the pipeline that analyzes billing data also tracks its own costs — dogfooding Query Tags on itself.
The dashboard includes:
- KPIs: Total tagged queries, total compute seconds, distinct dbt models
- Daily activity: Query count and compute time per day, split by environment
- Model breakdown: Compute time per model, colored by materialization type
- Materialization split: Pie chart showing how compute distributes across table, view, and metric_view
- Query detail table: Every tagged query with model, duration, environment, and executor
In our reference project, the four mart models accounted for 92% of compute time — without Query Tags, that insight was invisible.
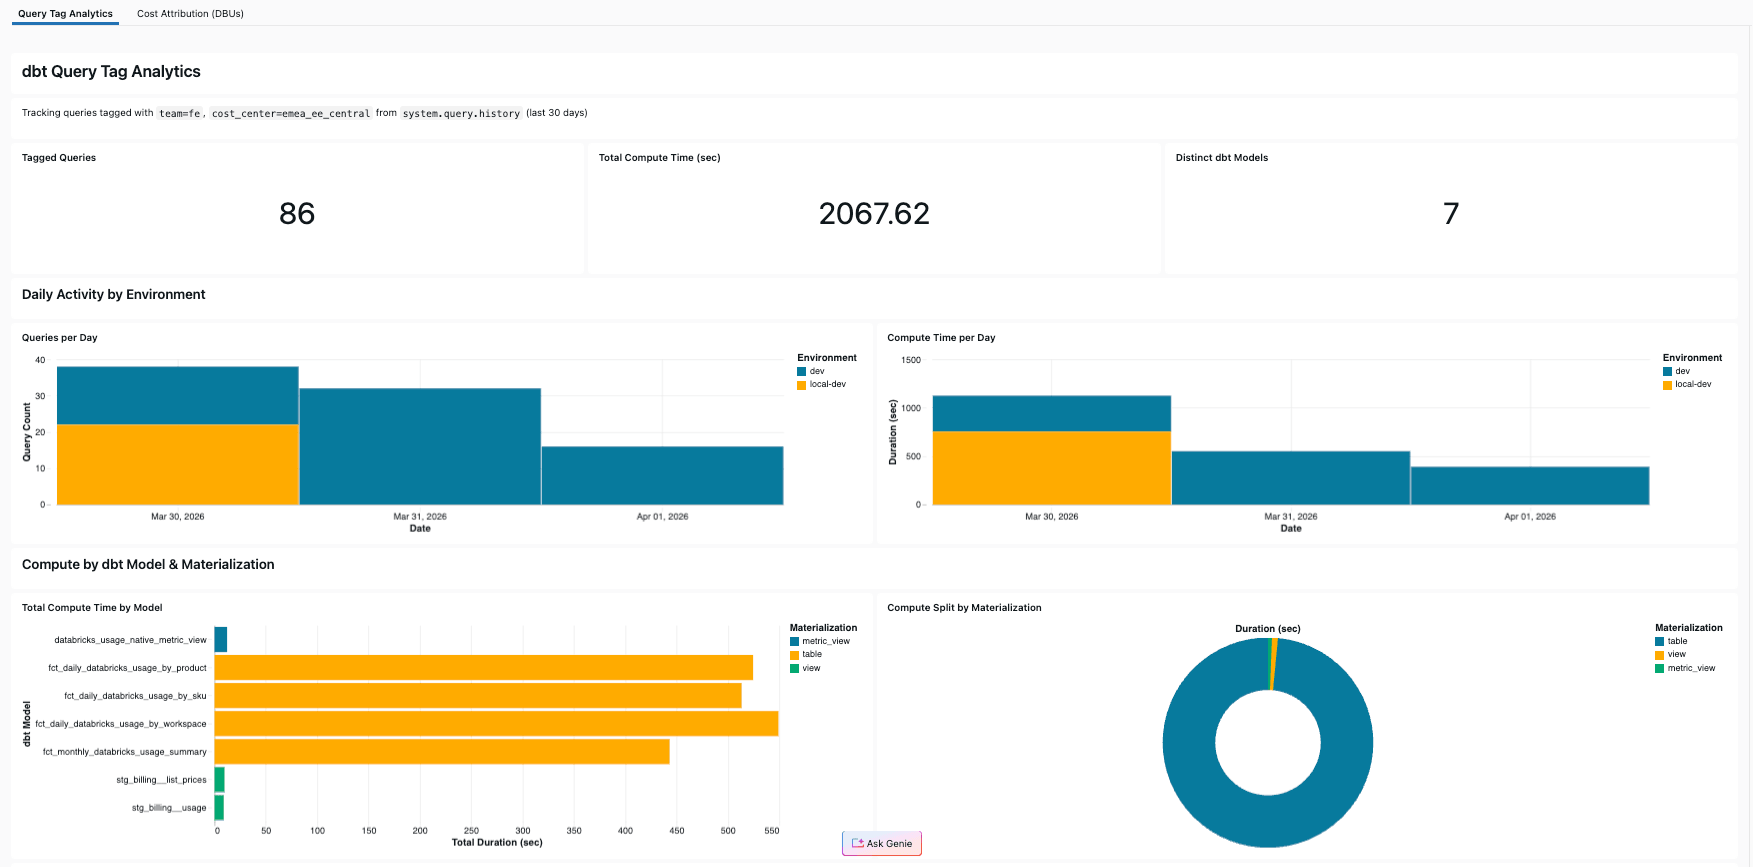
Building this dashboard yourself takes minutes with Genie Code: ask it for compute time per dbt model from system.query.history filtered by your query tags, and it writes the SQL and assembles the visuals. If you’d rather skip straight to the finished result, the dashboard also ships in the reference project and deploys with one databricks bundle deploy alongside the dbt job (see the Github repository for the detailed guide).
Tagging metric views
Databricks metric views (available with dbt-databricks 1.12+) are a new materialization type that defines reusable business semantics in the form of dimensions and measures directly in Unity Catalog (see full documentation). They can carry Query Tags just like any other model, using the query_tags config parameter:
Note the distinction: query_tags are attached to the SQL queries that create or refresh the metric view (tracked in system.query.history), while databricks_tags are Unity Catalog tags on the object itself (for governance and discovery). The former is for query-level tracking, while the latter one is Unity Catalog object level for overall data discoverability.
Best practices for tagging dbt projects
In this article, we covered the holistic process to build a solid FinOps practice where Query Tags are foundational for cost attribution. Here’s what we learned building the reference project and talking with dbt power users:
- Use a consistent tag hierarchy. Define organization-wide tags at the profile level (team, cost_center, project_name, env) and reserve model-level tags for exceptional cases. This keeps tags predictable and avoids per-model configuration sprawl.
- Always tag the environment. Use different env values for local development (local-dev) and deployed jobs (dev, staging, prod). This lets you separate ad-hoc development queries from scheduled production runs in your analytics. In our reference project, the local profile sets “env”: “local-dev” while the deployed profile sets “env”: “dev”.
- Use `project_name` to distinguish pipelines. When multiple dbt projects share a warehouse, project_name lets you attribute costs per pipeline without splitting warehouses. Combined with the auto-injected @@dbt_model_name, you get full traceability: project → model → materialization.
- Don’t over-tag. The auto-injected tags already cover model name, materialization type, and adapter versions. You rarely need to duplicate this information in custom tags. Focus custom tags on business context that dbt can’t infer: team ownership, cost center, project identity.
- Tag metric views explicitly. Since metric views are a newer materialization, it’s useful to tag them with a feature key (e.g., “feature”: “metric_view”) so you can easily filter for metric view creation queries in your cost analysis.
Try it yourself
The complete reference project is available on GitHub: github.com/databricks-solutions/dbt-query-tags
To get started:
- Clone the repository
- Create a Python 3.12 virtual environment and install dependencies: pip install dbt-databricks>=1.12.0a1
- Update profiles.yml with your workspace host, SQL warehouse HTTP path, catalog, and custom query tags
- Run dbt deps && dbt run –profiles-dir . to execute the pipeline
- Query system.query.history to see your tags in action
- Update dbt_profiles/profiles.yml and databricks.yml to point to correct configuration.
- Deploy with databricks bundle deploy for scheduled runs and the analytics dashboard
Swap in your own team and cost center values. The pattern works for any dbt project on Databricks.
Clone the repository today! It takes one line in your profile to unlock model-level usage attribution visibility across your entire warehouse.