
The Visualization Challenge in Multi-Platform Delivery
Your team has worked hard to build a Supervisor Agent that accurately analyzes Q4 revenue and identifies growth drivers. The next challenge lies in making these insights available where stakeholders actually work, such as Microsoft Teams. Because every external platform utilizes a unique visual language, integrating rich graphical answers can be difficult, often forcing agents to default to basic text tables.
This is where the inherent flexibility of the Supervisor Agent becomes a distinct advantage. Databricks designed the agent framework to support extensive customization through tools like Unity Catalog Functions and the Model Context Protocol (MCP). By leveraging these integrations alongside Vega-Lite, developers can overcome platform-specific limitations and create portable, high-quality visualizations. This approach ensures that the Supervisor Agent delivers clear, graphical insights that maintain their context and impact, regardless of the destination application.
Understanding the Supervisor architecture
Agent Bricks facilitates production‑ready AI through a Supervisor Agent that orchestrates specialized tools to handle multi‑domain queries. In supported Databricks clouds and regions, this architecture allows a supervisor to delegate tasks intelligently:
- Genie Spaces: handles natural language SQL queries against structured data.
- Knowledge Assistant agents: perform document retrieval and analysis (RAG).
- Unity Catalog Functions: encapsulate custom business logic.
- Model Context Protocol (MCP) servers: manage third‑party integrations.
This system excels at task decomposition. For a request like “Compare Q4 revenue across regions,” the Supervisor routes the quantitative analysis to Genie while simultaneously querying a Knowledge Assistant for contextual documents.

Extending Multi-Agent Systems With Governed Visualizations
Data agents require a reliable method to transform raw data into actionable visual insights. By combining Unity Catalog Functions with Vega-Lite, developers can generate governed, portable visualizations that agents return alongside text and data.
- Unity Catalog Functions centralize and govern visualization logic, allowing agents to call a secure, reusable function that generates charts from structured data.
- Vega-Lite uses a concise JSON specification to declaratively describe charts, allowing agents to generate visualizations without writing imperative plotting code.

Together, this approach lets agents return governed visualizations as easily as they return text. Vega-Lite can also reduce implementation overhead compared to imperative charting code, with additional benefits:
- API-native and portable: JSON specs render consistently across APIs, apps, and chat tools.
- LLM-friendly: Compact specs are typically easier to generate and validate in constrained context windows.
- Self-validating: Schema-based validation enables fast correction.
- Built-in best practices: Defaults produce clear, accessible charts automatically.
- Secure by design: Declarative JSON avoids risks of generated plotting code.
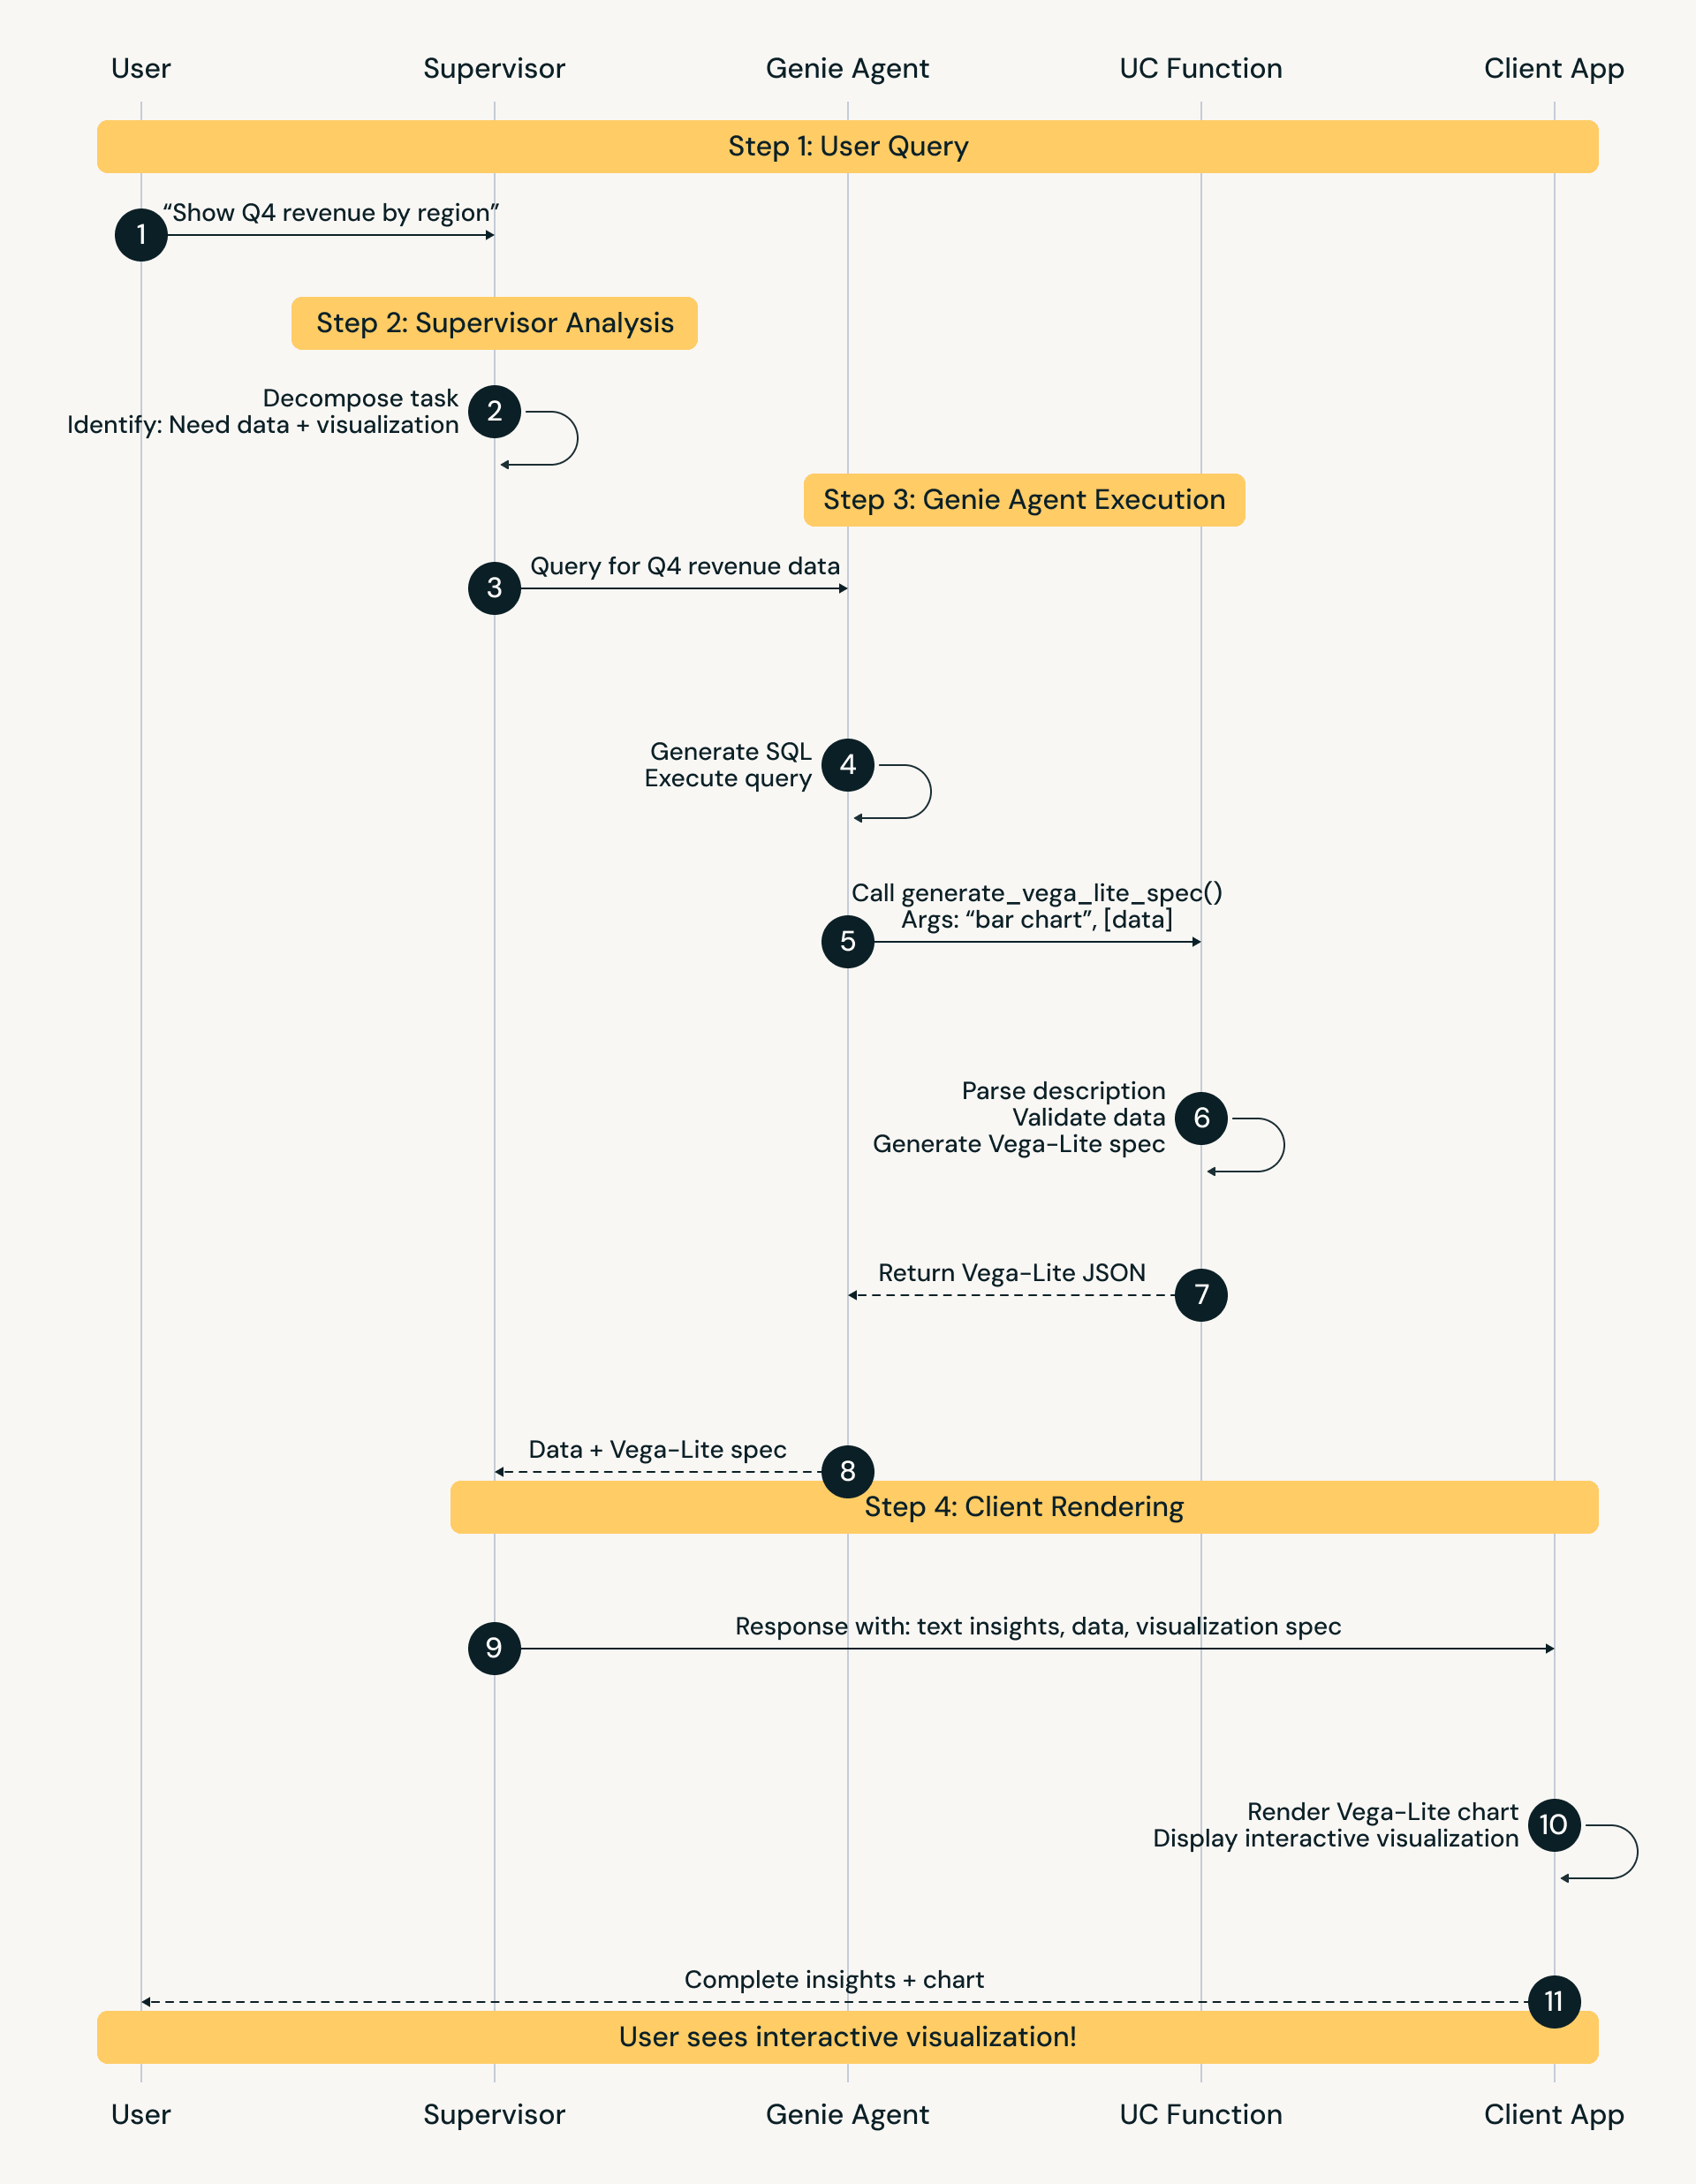
The Supervisor Workflow
A Supervisor Agent orchestrates this process. It delegates retrieval and analysis to sub‑agents, invokes Unity Catalog functions for governed post-processing, and then composes the final response.
Information flow:
- User query: “Compare Q4 revenue across regions and show top‑performing products.”
- Supervisor: decomposes the request and delegates to Genie and other relevant tools.
- Supervisor: invokes a Unity Catalog function to produce a Vega‑Lite spec from structured results.
- Supervisor: aggregates text, data, and visualizations into a final response.
- Client: renders Vega‑Lite specs inline.
Example supervisor tool call:
Implementation via Unity Catalog Function
One robust implementation strategy is a Unity Catalog function that accepts data and chart requirements as input and returns a valid Vega‑Lite specification.
The Generator Function
The UC function acts as a translation layer between agent outputs and visualization:
- Validates input data (non-empty JSON array)
- Infers schema (categorical vs. quantitative fields)
- Selects a chart type from the request (for example: bar, line, scatter)
- Constructs a Vega-Lite JSON spec with encoding, dimensions, and tooltips
Client‑side rendering
The final step is rendering the visualization for the user, which depends on the client platform.
Web applications: use vegaEmbed() in JavaScript to parse the JSON spec and render an interactive chart in the browser.

Real‑world use cases and benefits
Teams in financial services, healthcare, and sales are exploring Vega‑Lite‑enabled agent systems to drive faster, more intuitive decision-making.
Use case: financial analysis dashboard in Teams
Scenario: A CFO asks in Microsoft Teams, “How did we perform in Q4 compared to forecast? Break down by region and product category.”
Multi‑agent workflow:
- Supervisor: Decomposes the request and routes tasks to Genie agents and a Unity Catalog Function.
- Genie execution:
- Agent A returns regional revenue data and a Vega‑Lite spec for a bar chart with variance-colored bars.
- Agent B returns product category data and a stacked bar chart spec showing category contribution to regional totals.
- Synthesis: The Supervisor combines these inputs into a cohesive response that includes narrative insight and interactive charts.
Results:
The CFO receives a rich response directly in Teams, without having to navigate to external dashboards. The output includes a text summary of key drivers (for example, “Q4 exceeded forecast by 8% overall, driven by North region at +15% and Software category at +22%, while South region underperformed by 5%”), followed immediately by the Vega‑Lite charts. Users can hover over bars to reveal exact values through tooltips, preserving conversation context while enabling deep exploration.
Benefits:
- Immediate clarity: Trends are visible at a glance rather than inferred from tables.
- Interactive exploration: Hover states and tooltips reveal exact values on demand.
- Workflow continuity: Insights stay inside Teams, not external BI tools.
- Faster time to insight: ~30 seconds for a visual answer vs. ~30 minutes to export, chart, and interpret manually.
Illustrative benefits across use cases
The ranges below are representative of early pilot observations and should be treated as directional examples, not universal benchmarks:
| Metric | Without visualization | With Vega-Lite (agent-generated) | Improvement |
|---|---|---|---|
| Time to insight | 10-15 min (query → export → plot → interpret) | 30-60 sec (query → instant visual) | 80-90% faster |
| Questions answered per session | 2-3 (sequential, requires breaks to create charts) | 8-12 (rapid iteration with instant visual feedback) | 3-4x more |
| Non-technical user adoption | 30-40% (need help interpreting tables) | 70-85% (visual insights self-explanatory) | ~2x adoption |
| Agent response satisfaction | 3.2/5 (data without context is frustrating) | 4.6/5 (complete insights valuable) | ~40% higher |

Conclusion: Enabling Visual Intelligence in Multi‑Agent Systems
Multi-agent systems can analyze complex queries, but without visuals, they often return only text and tables. Combining Vega-Lite with Unity Catalog Functions enables agents to generate governed, portable visualizations that render across applications while respecting data permissions.
Early deployments indicate materially faster time to insight and improved adoption when insights include visuals. As multi-agent systems become core to enterprise workflows, the ability to not just compute answers but show them will be essential.
To start building, visit the Agent Bricks documentation and explore how Unity Catalog Functions can transform your agent ecosystem.
Have questions about implementing Vega‑Lite visualizations in your agent systems? Join the discussion in the Databricks Community Forums.